Disclaimer:Trading futures and micro-futures contracts involves substantial exposure to capital loss. Due to the inherent power of leverage, losses can rapidly exceed your initial margin deposit. This guide is designed strictly for technical and educational purposes and does not constitute investment advice. A trading journal is not a ticket to profitability, but a mathematical tool used to audit tick values and margin efficiency. Always consult with a certified risk professional before engaging with leveraged derivatives.
The futures market is a cold, contract-oriented arena. In stark contrast to the "buy-and-hold" philosophy of the equity markets, where an investor can weather a devaluation for years, futures traders operate against hard expiration dates and real-time margin settlement. This is a true zero-sum environment: every tick of profit is a direct extraction from a counterparty across the same temporal axis.
While the accessibility of index products like the E-mini S&P 500 (ES) and Nasdaq 100 (NQ) has attracted a wave of retail participants seeking tax advantages and high capital efficiency, this leverage is a double-edged sword. In a landscape where a single algorithmic headline can trigger a 50-point liquidation, relying on intuition or a basic P&L summary is a recipe for disaster.
To survive the friction of high-velocity markets, you must develop a deep "Contractual Awareness." This requires a specialized auditing system that monitors the interplay between tick math and margin maintenance. In this guide, we will break down the architecture of a professional futures journal, exploring how to log Order Flow imbalances and manage the liquidity risks associated with contract rollovers.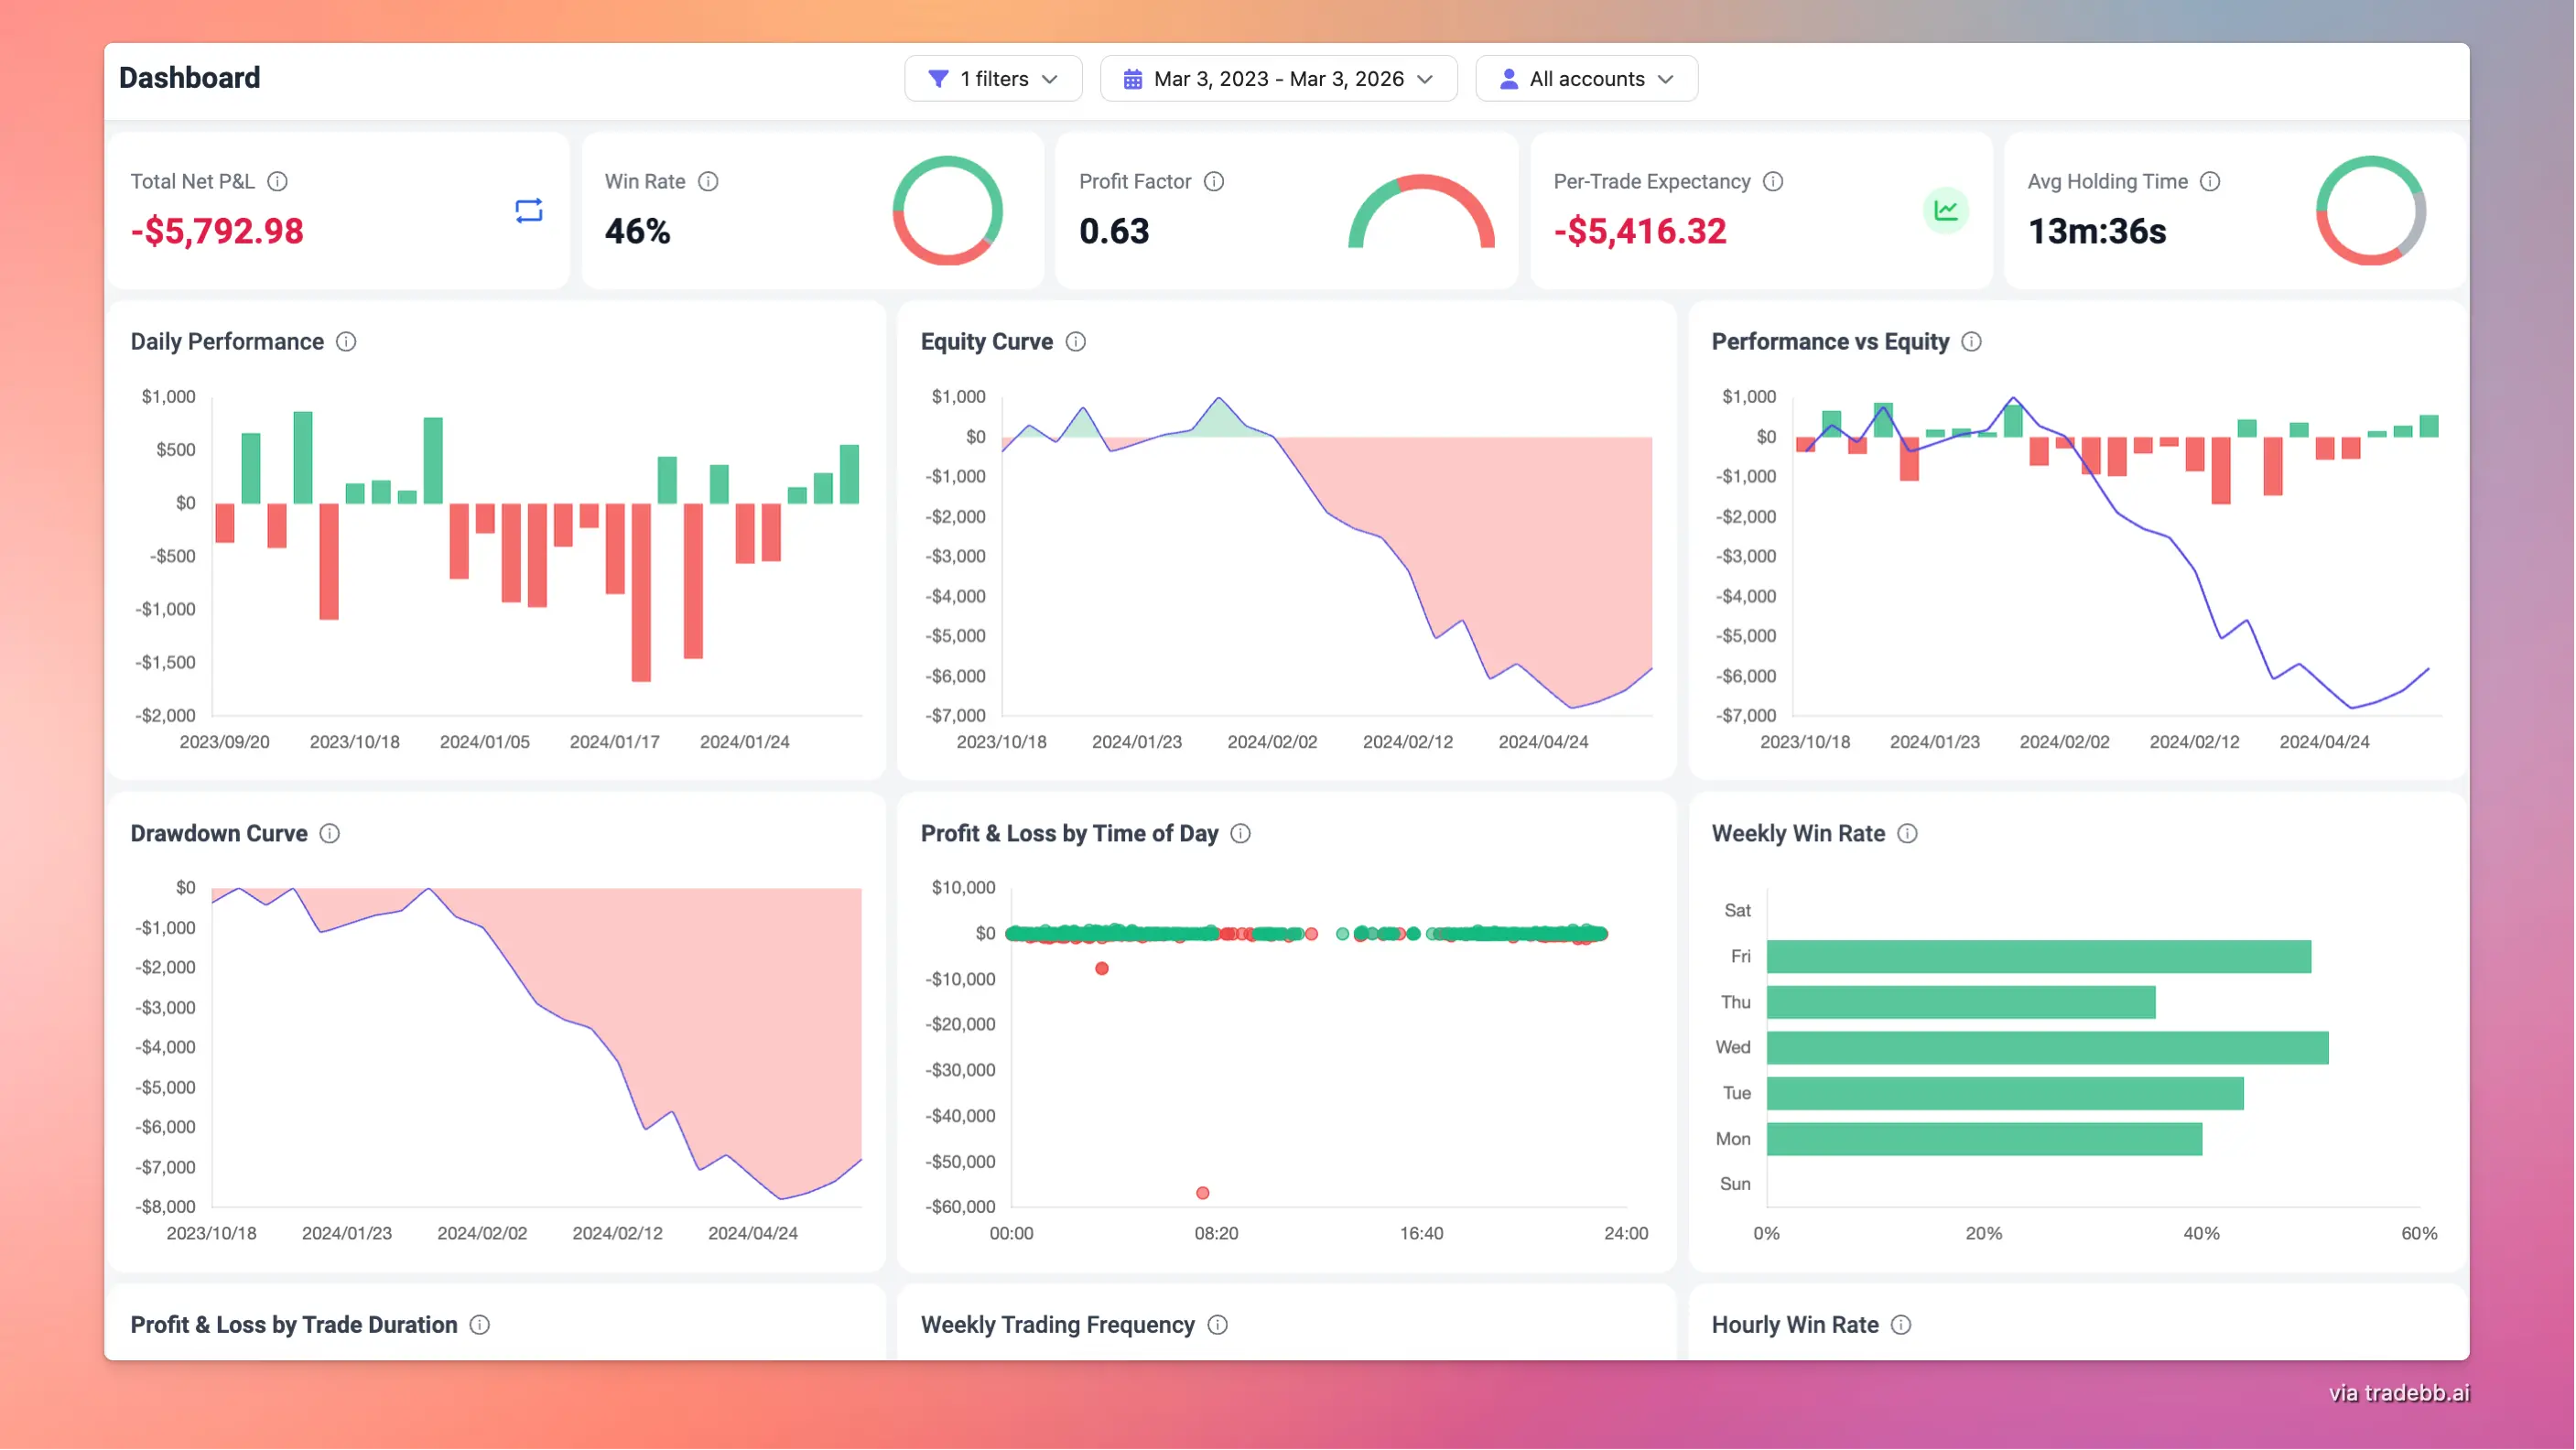
The Institutional Mindset: Why Futures Require a Different Ledger
To navigate this, a professional ledger must move beyond simple P&L to capture the mechanics of leverage:
- Span Margin vs. Reg T: Futures do not use standard Regulation T margin like stocks. They use SPAN (Standard Portfolio Analysis of Risk) margin, which acts as a performance bond. A journal must track your account drawdown relative to your broker's strict intraday maintenance margin to avoid automated liquidation.
- Standardized Multipliers: A 1-point move in the E-mini S&P 500 (ES) is worth $50 per contract. A 1-point move in Crude Oil (CL) is worth $1,000. Your tracking system must automatically standardize these different tick and point values so you can analyze your risk-to-reward ratio objectively.
- The Expiration Reality: Futures contracts expire (typically quarterly for equity indices and monthly for commodities). Your ledger must track which contract month you traded to ensure you are auditing the correct liquidity pool.
Standardized Contracts and Tick Values: The Baseline Data
The most critical quantitative shift when moving to the futures market is learning to think in terms of "Ticks" and "Points" rather than just dollars and cents.
A "tick" is the minimum price fluctuation a futures contract can make. A professional online futures trading journal translates these fractional movements into standardized data. Your system must track:
Normalizing Tick Expectancy
Different assets have completely different tick increments.
- The ES (E-mini S&P 500) moves in 0.25 index point increments (one tick = $12.50).
- The YM (E-mini Dow) moves in 1.0 index point increments (one tick = $5.00).
If your journal only logs that you made "$100" on a trade, you are missing the context. Did you make $100 by catching a massive 20-tick move on a Micro contract (high skill), or did you make $100 by catching a tiny 2-tick move on a highly leveraged standard contract (high risk)?
Your journal must track your Net Ticks Captured. By filtering your performance by ticks rather than fiat currency, you can determine if your strategy actually has a positive mathematical expectancy, regardless of whether you are trading Micro (MES) or Mini (ES) contracts.
Product-Specific Win Rates
Futures traders often suffer from "product hopping." They might have a highly profitable strategy trading the slower, more methodical ES, but consistently lose capital when they try to apply the exact same strategy to the hyper-volatile Nasdaq (NQ). A robust journal allows you to categorize executions by product symbol, instantly revealing which specific assets align with your risk tolerance and reaction speed.
Tracking Order Flow and Execution Mechanics
In the futures pits, the market’s micro-structure isn't just data—it’s the pulse of the trade. Unlike fragmented equity dark pools, centralized exchanges like the CME deliver raw, high-fidelity volume data. This transparency allows professional participants to lean on Order Flow and the Depth of Market (DOM) for their entries.
However, a ledger that only records P&L misses the why behind the fill. To refine your edge, your journaling routine must categorize the tactical catalyst for every execution:
The DOM Narrative
Were you reacting to a "spoofing" limit order or a genuine wall of liquidity? By tagging entries with "Aggressive Absorption" or "Footprint Imbalance," you can audit whether your tape-reading skills are generating real alpha or simply fueling a cycle of impulsive overtrading.
Slippage and Liquidity Audits
In the chaos following a CPI print, the price you click is rarely the price you get. Your journal should treat Slippage as a mandatory metric—the tax you pay for entering the fray. If your logs consistently show a 2-to-3 tick slippage on breakouts, it’s a clear signal to pivot from stop-market orders toward the precision of stop-limits.
The Expiration Cycle and Rollover Audit
Unlike stocks, which can be held indefinitely, futures contracts have a finite lifespan. Equity index futures typically expire quarterly (March, June, September, December).
As a contract approaches expiration, institutional volume migrates to the next quarter's contract in a process known as "The Roll." Trying to day-trade a contract during rollover week can be incredibly dangerous, as liquidity thins out in the front month, leading to erratic price action and widened spreads.
The Journaling Rule: Your futures tracking system must log the specific contract month traded (e.g., ESM4 for June 2024, ESU4 for September 2024).
If you conduct a monthly review and notice a cluster of unnecessary losses occurring precisely during the second week of the expiration month, your journal has identified a structural, repeating error. You can then create a strict operational rule to transition to the back-month contract earlier, avoiding the low-liquidity chop.
Case Scenario: Documenting a Micro E-mini (MES) Breakout
Note: The following is a hypothetical sequence created purely for educational purposes to demonstrate the depth of data organization required for a professional futures journal entry.
To illustrate the necessary depth of data collection, let us examine how a day trader logs an execution on the Micro E-mini S&P 500 (Ticker: MES).
Phase 1: The Pre-Trade Setup & Hypothesis
- Date & Session: Tuesday, October 24. New York Morning Session (09:45 AM EST).
- Contract Traded: MESZ3 (December contract).
- Macro Context: No major tier-1 data releases scheduled for the session.
- Technical Setup: The market opened with a gap down, filled the gap, and is now forming a volume consolidation node at 4250.
- The Thesis: If aggressive buyers break through the 4252 resistance level on the DOM, the market should rapidly test the overnight high of 4260.
Phase 2: The Execution Parameters
- Position Size: 3 MES contracts. (At $5 per point, a 1-point move equals $15).
- Entry: Buy Stop-Market triggered at 4252.25. (Trader notes 1 tick of slippage from the intended 4252.00 entry).
- Hard Stop Loss: Placed beneath the volume node at 4248.00 (4.25 points of risk per contract = $63.75 total risk).
- Take Profit Target: Scale out 2 contracts at 4258.00, leave 1 runner for 4260.00.
Phase 3: Trade Management & Autopsy
- Update (10:05 AM EST): Price surges to 4258.00. Two contracts automatically sell for a +5.75 point gain. The stop loss on the remaining runner is moved to breakeven (4252.25).
- Update (10:15 AM EST): The market reverses sharply, stopping out the final runner at breakeven.
- Net Result: +11.5 total points captured across the scaled position ($57.50 gross profit).
- Journal Takeaway: The structural thesis was correct, but tracking the tape showed aggressive sellers stepping in at 4258. The mechanical rule to scale out and move the stop loss to breakeven protected the capital. The 1 tick of entry slippage was acceptable given the volatility.
Migrating from Spreadsheets to Automated Contract Tracking
As demonstrated by the tick calculations and scaled-out exits in the case scenario, managing a fast-paced futures day-trading operation in a basic spreadsheet is a massive administrative bottleneck. If you take 10 scalps a day, manually inputting entry prices, exit prices, slippage, and calculating the dollar-value of ticks across multiple contract types is completely unsustainable.
To solve this friction, active market participants rely on specialized performance analytics engines designed specifically for derivative contract logic. When evaluating how to systematize your workflow, look for modern solutions that provide:
- Direct Clearinghouse/Broker Integration: The ability to automatically sync execution data via API from futures-specific platforms like NinjaTrader, Tradovate, or CQG. This ensures every tick and micro-second timestamp is recorded perfectly.
- Automated Tick-to-Fiat Conversion: The system must instinctively know that a trade on the NQ has a $20 point multiplier, while a trade on the MNQ has a $2 point multiplier, instantly calculating your exact net P&L after clearing and exchange fees.
- Time-of-Day Heatmaps: Visual dashboards that aggregate your execution timestamps to reveal exactly when you are most profitable (e.g., the first 30 minutes of the NY Open) and when you should step away from the screens.
Analytical tools engineered for this specific market, such as TradeBB.ai, exist to eliminate the complex math associated with standardized contracts. By visualizing your performance through the lens of ticks captured rather than just dollars made, these platforms allow traders to focus their cognitive energy on reading the order flow rather than updating spreadsheet cells.
(Are you managing a diversified portfolio that includes linear equities or spot assets? Your tracking architecture must adapt to each environment. Read our comprehensive guides on structuring a Stock Tracking System and a Crypto Trading Framework.)
Frequently Asked Questions (FAQs)
Can I use an options trading journal to track futures contracts?
Generally, no. While both are derivatives, options journals focus heavily on decaying variables (Theta, Implied Volatility, and Greeks) and multi-leg spreads. Futures are linear derivatives without time decay (prior to expiration). A futures journal must focus on tick-value conversions, span margin utilization, and order flow tagging.
Why is it important to track "ticks" instead of just my dollar P&L?
Tracking only your fiat P&L masks your actual skill level. If you increase your leverage from 1 contract to 10 contracts, you can make a large amount of money on a very small, random price movement. Tracking your net ticks captured provides an objective, normalized metric of how well your strategy actually identifies market direction, regardless of the position size used.
Do I need to track Micro and Mini contracts separately in my journal?
Yes. While the Micro (MES) and the Mini (ES) track the exact same underlying index, retail traders often treat them differently psychologically due to the different dollar multipliers. By filtering your journal data, you might discover that you are highly disciplined when trading Micros, but become emotional and move stop-losses when trading the heavier Mini contracts.
How does tracking commissions differ in futures compared to stocks?
Most stock brokers offer zero-commission trading, making gross P&L and net P&L practically identical. In futures, you pay exchange fees, NFA fees, and routing fees on every single contract traded (both entry and exit). If you are a high-frequency scalper, these fees can consume a massive portion of your profits. A professional journal automatically deducts these fees to show your true Net Expectancy.
Will using a futures trading journal prevent me from getting a margin call?
No tool can prevent margin calls or guarantee profitability. A tracking system provides historical, objective data regarding your past execution habits and risk management. It is up to the individual trader to review that data, recognize when they are overleveraged, and enforce the discipline required to size their positions appropriately relative to their account equity.
Authoritative Resources for Futures Data
To ensure your fundamental market context is accurate when logging trades, it is highly recommended to reference official clearinghouse and regulatory data:
- CME Group (Chicago Mercantile Exchange): The world's leading derivatives marketplace. The CME website is the definitive source for checking standardized contract specifications, tick values, and official expiration calendars. (CME Group)
- Commodity Futures Trading Commission (CFTC): The independent U.S. government agency that regulates the futures and options markets. Their weekly Commitment of Traders (COT) report provides essential macro data on how commercial hedgers and large speculators are positioned. (CFTC COT Reports)
- National Futures Association (NFA): The self-regulatory organization for the U.S. derivatives industry, providing critical educational resources regarding margin requirements, clearing fees, and broker regulations. (NFA)