
The Automated TradeLocker Journal for Professional Traders
Stop analyzing raw executions. Start analyzing complete trades.
TradeLocker is a next-generation platform known for its slick interface and trading-on-chart features. But when it comes to review, its native "History" tab often shows a fragmented list of individual fills (executions) rather than the full story of your trade.
TradeBB connects directly to your account to build a unified TradeLocker trading journal. We don't just copy the data; we intelligently merge your partial fills, scaling-ins, and scaling-outs into single, consolidated trade records. This gives you accurate statistics on your Average Entry, Net PnL, and true holding time.
We use imported data only to provide journaling and analytics. Data is encrypted in transit and at rest, with strict access controls. You can disconnect and delete your data anytime.
Read our Privacy PolicyIntelligent Data Parsing: From "Fills" to "Trades"
TradeLocker reports data as individual "Executions." If you scale into a position three times and exit once, a basic spreadsheet sees four rows. TradeBB sees one trade.
Our engine maps the raw TradeLocker fields to standardized TradeBB fields, handling the math so you don't have to.
How we translate TradeLocker data into edge:
| Raw TradeLocker Field | Smart Parsing (TradeBB) | The Trader Benefit |
|---|---|---|
| Executions (Buy/Sell) | Merged Trade | We aggregate all filledQty and price data points with the same ID to calculate your true Avg Entry Price and Avg Exit Price. |
| Side (Buy/Sell) | SIDE (Long/Short) | We parse the direction automatically. Filter your TradeLocker journal to see if your Longs outperform your Shorts. |
| stopPrice / takeProfit | STOP_LOSS / TAKE_PROFIT | We capture your initial risk parameters. Compare your actual Exit Price against your planned stopPrice to track your discipline. |
| createdDate | DURATION | By comparing the timestamp of your first entry execution and your last exit execution, we calculate the exact Duration of the trade. |
Visualize Your Edge (What You See After Sync)
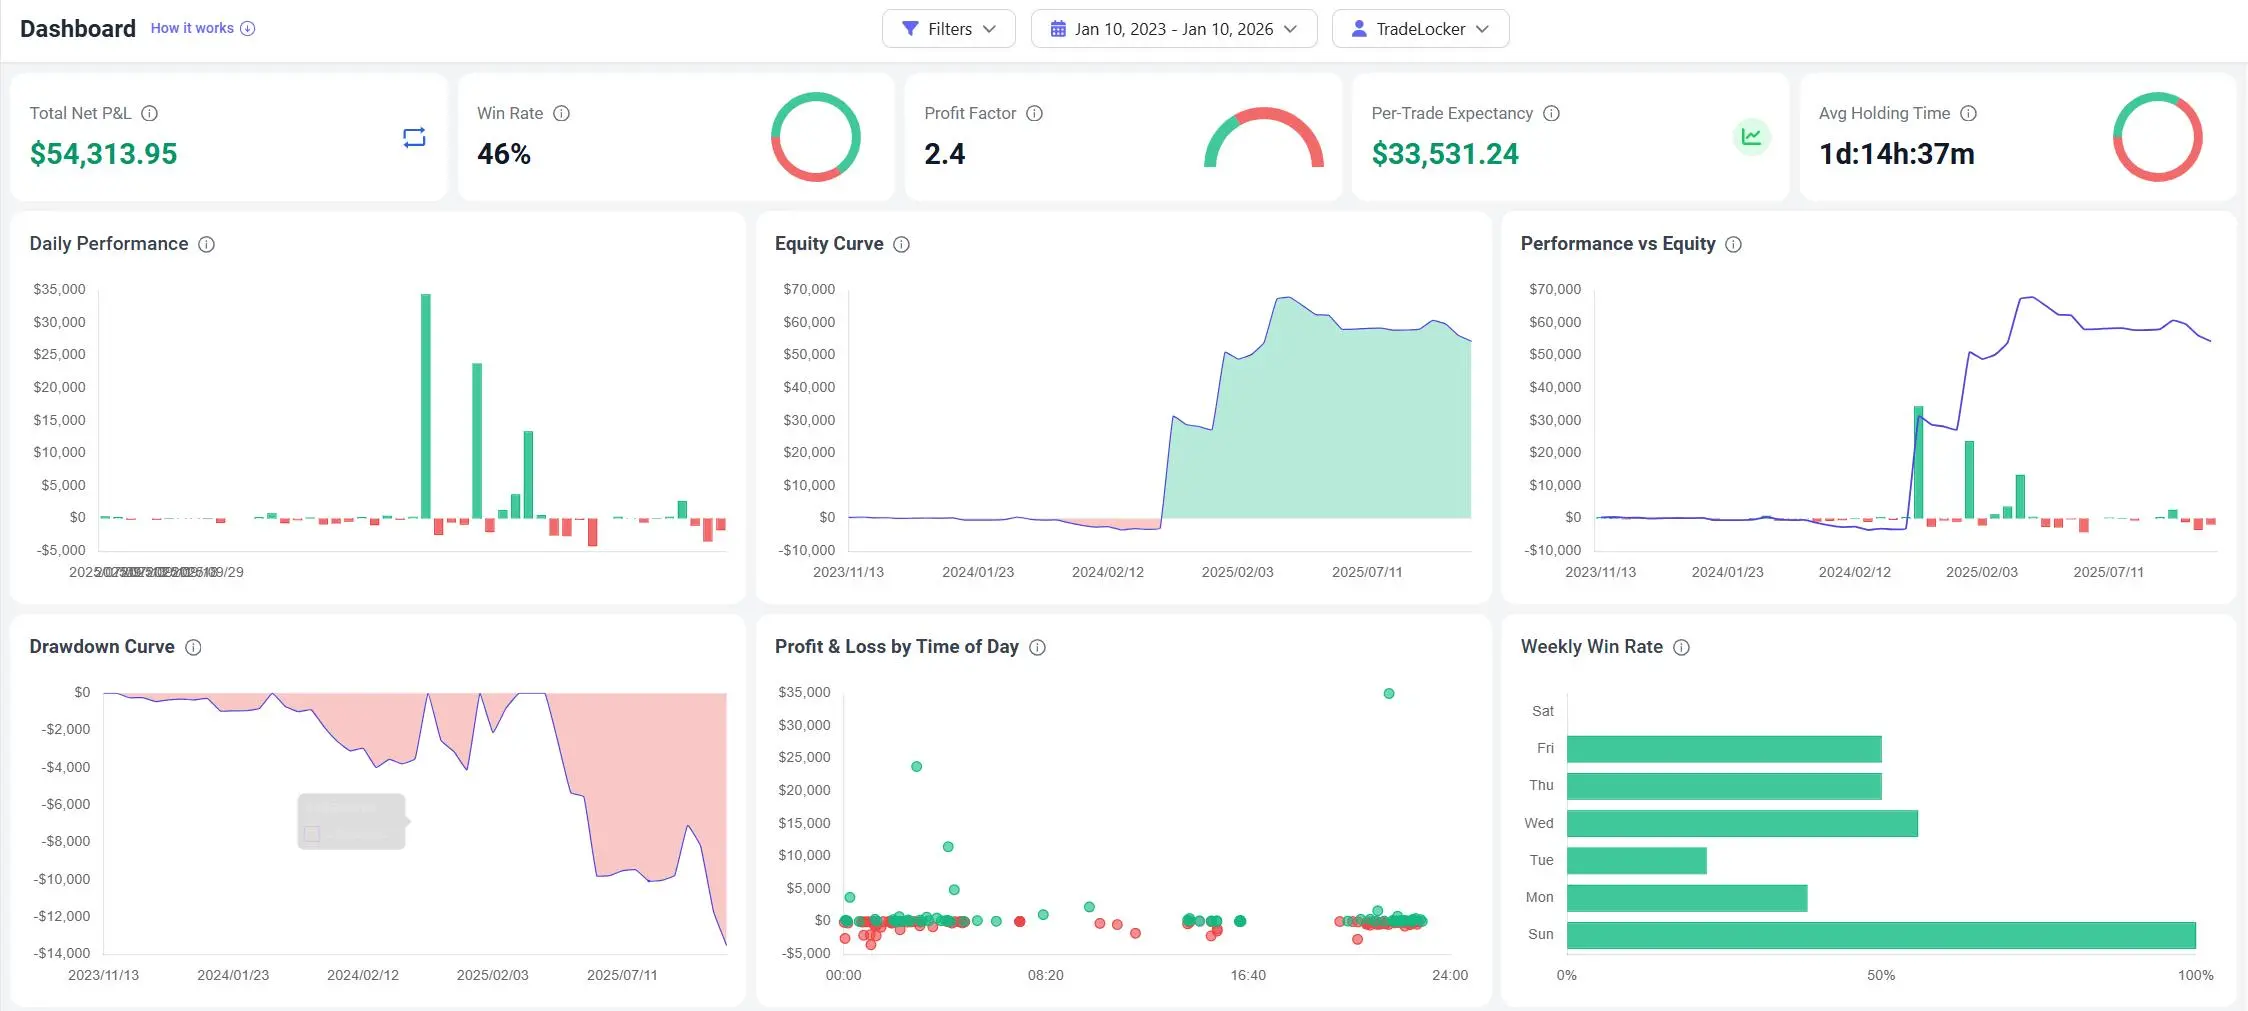
1. The Dashboard: Your Equity Curve
Go to your Dashboard to monitor your account health.
- True Equity Curve: Visualized based on the aggregated results of your merged trades.
- Win Rate & R-Multiple: See if you are truly hitting your risk-reward targets (e.g., are you consistently hitting 2R?).
- Profit by Hour: Identify which sessions provide the cleanest moves for your strategy.
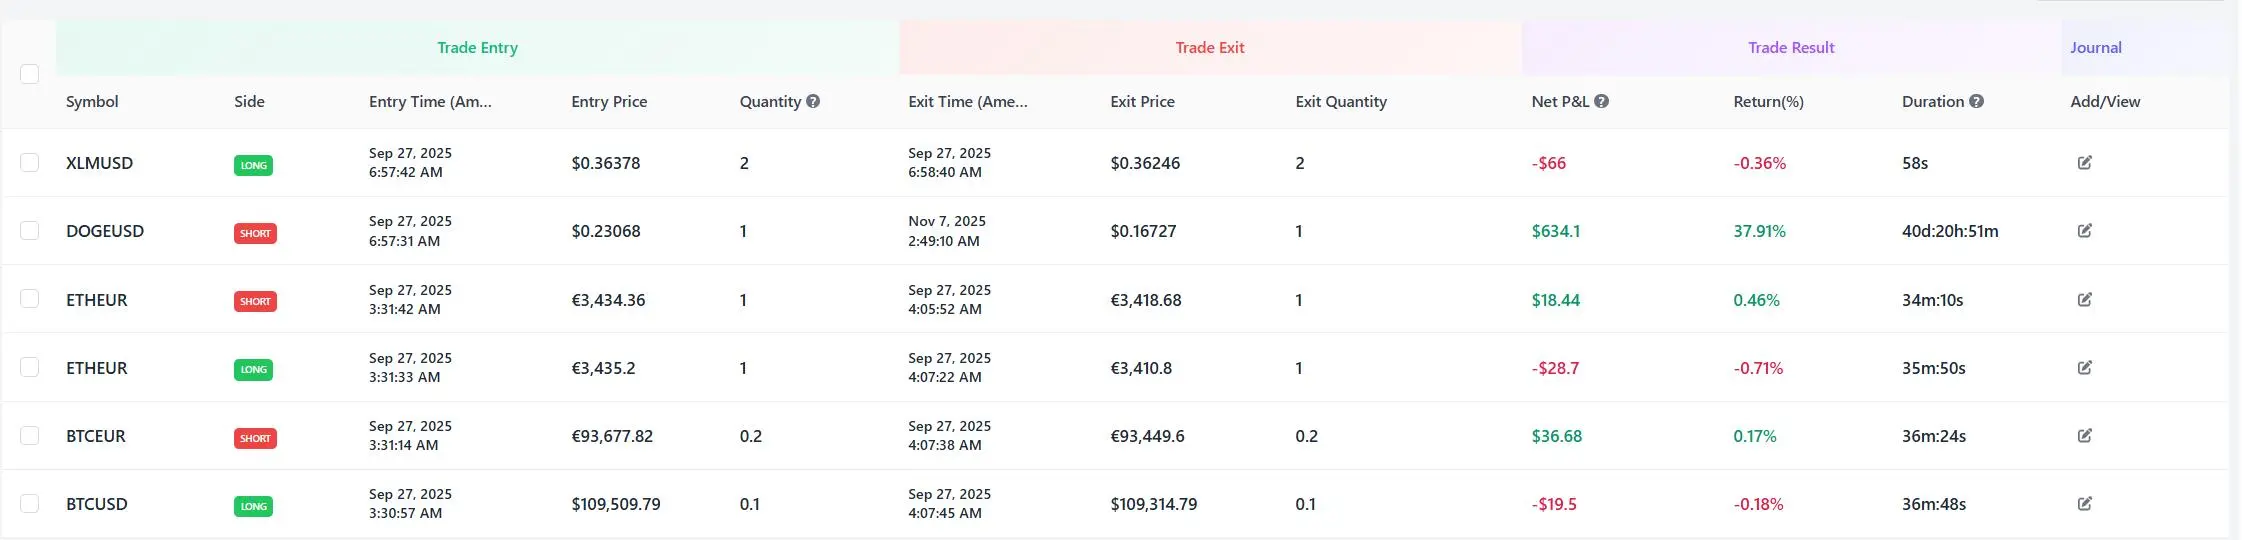
2. The Trades Table: Granular Review
Go to Trades to review your strategy.
- Clean List View: Instead of 50 rows of "fills," see 10 clean rows of "Trades."
- Discipline Review: Check the Stop Loss column to audit if you adhered to your risk parameters on every single trade.
Why a TradeLocker Journal is Better Than Excel
Excel struggles with "Many-to-One" relationships. Trying to manually merge 5 buy fills into 1 average price using spreadsheet formulas is painful and prone to error.
- Automated Merging: We handle the weighted average math instantly.
- Discipline Tracking: Excel doesn't know where your stopPrice was relative to your entry. We do.
- Always Live: No need to export a CSV every time you take a trade.
TradeLocker FAQ
Does TradeBB support manual file uploads for TradeLocker?
Currently, we offer a specialized Direct Sync integration for TradeLocker to ensure data accuracy. The raw file exports from TradeLocker can be complex to merge manually, so our direct connection ensures your stats are always perfectly calculated.
Can I use this for Prop Firm accounts on TradeLocker?
Yes. Whether you are on a challenge or a funded account, as long as it uses the TradeLocker platform, we can sync it. You can track your drawdown limit visually on our dashboard.
Does this work for all assets on TradeLocker?
Yes. Our engine is asset-agnostic. Whether you are trading indices, metals, or other instruments, we parse the symbols and calculate the PnL correctly.
How do you calculate the entry price for scaling in?
We use a weighted average calculation. If you buy 1 lot at 100and1lotat110, your journal will show a single trade with a quantity of 2 and an Avg Entry of $105
Related Brokers
Broker not listed? Use Any Broker (AI) to upload your trade history file.