
Stock Trading Journal Software for Trade Review and Performance Analysis
Import stock trades from your broker
TradeBB supports stock trade imports and integrations for a wide range of brokers and trading platforms. Depending on the platform, you can either sync your account directly or upload your trade history file for analysis and review.
Review which stock setups actually perform best
TradeBB helps stock traders analyze performance across symbols, sectors, setups, tags, earnings plays, and trading behavior to better understand which trading patterns are producing consistent results.
Analyze stock performance across symbols, setups, and trading activity
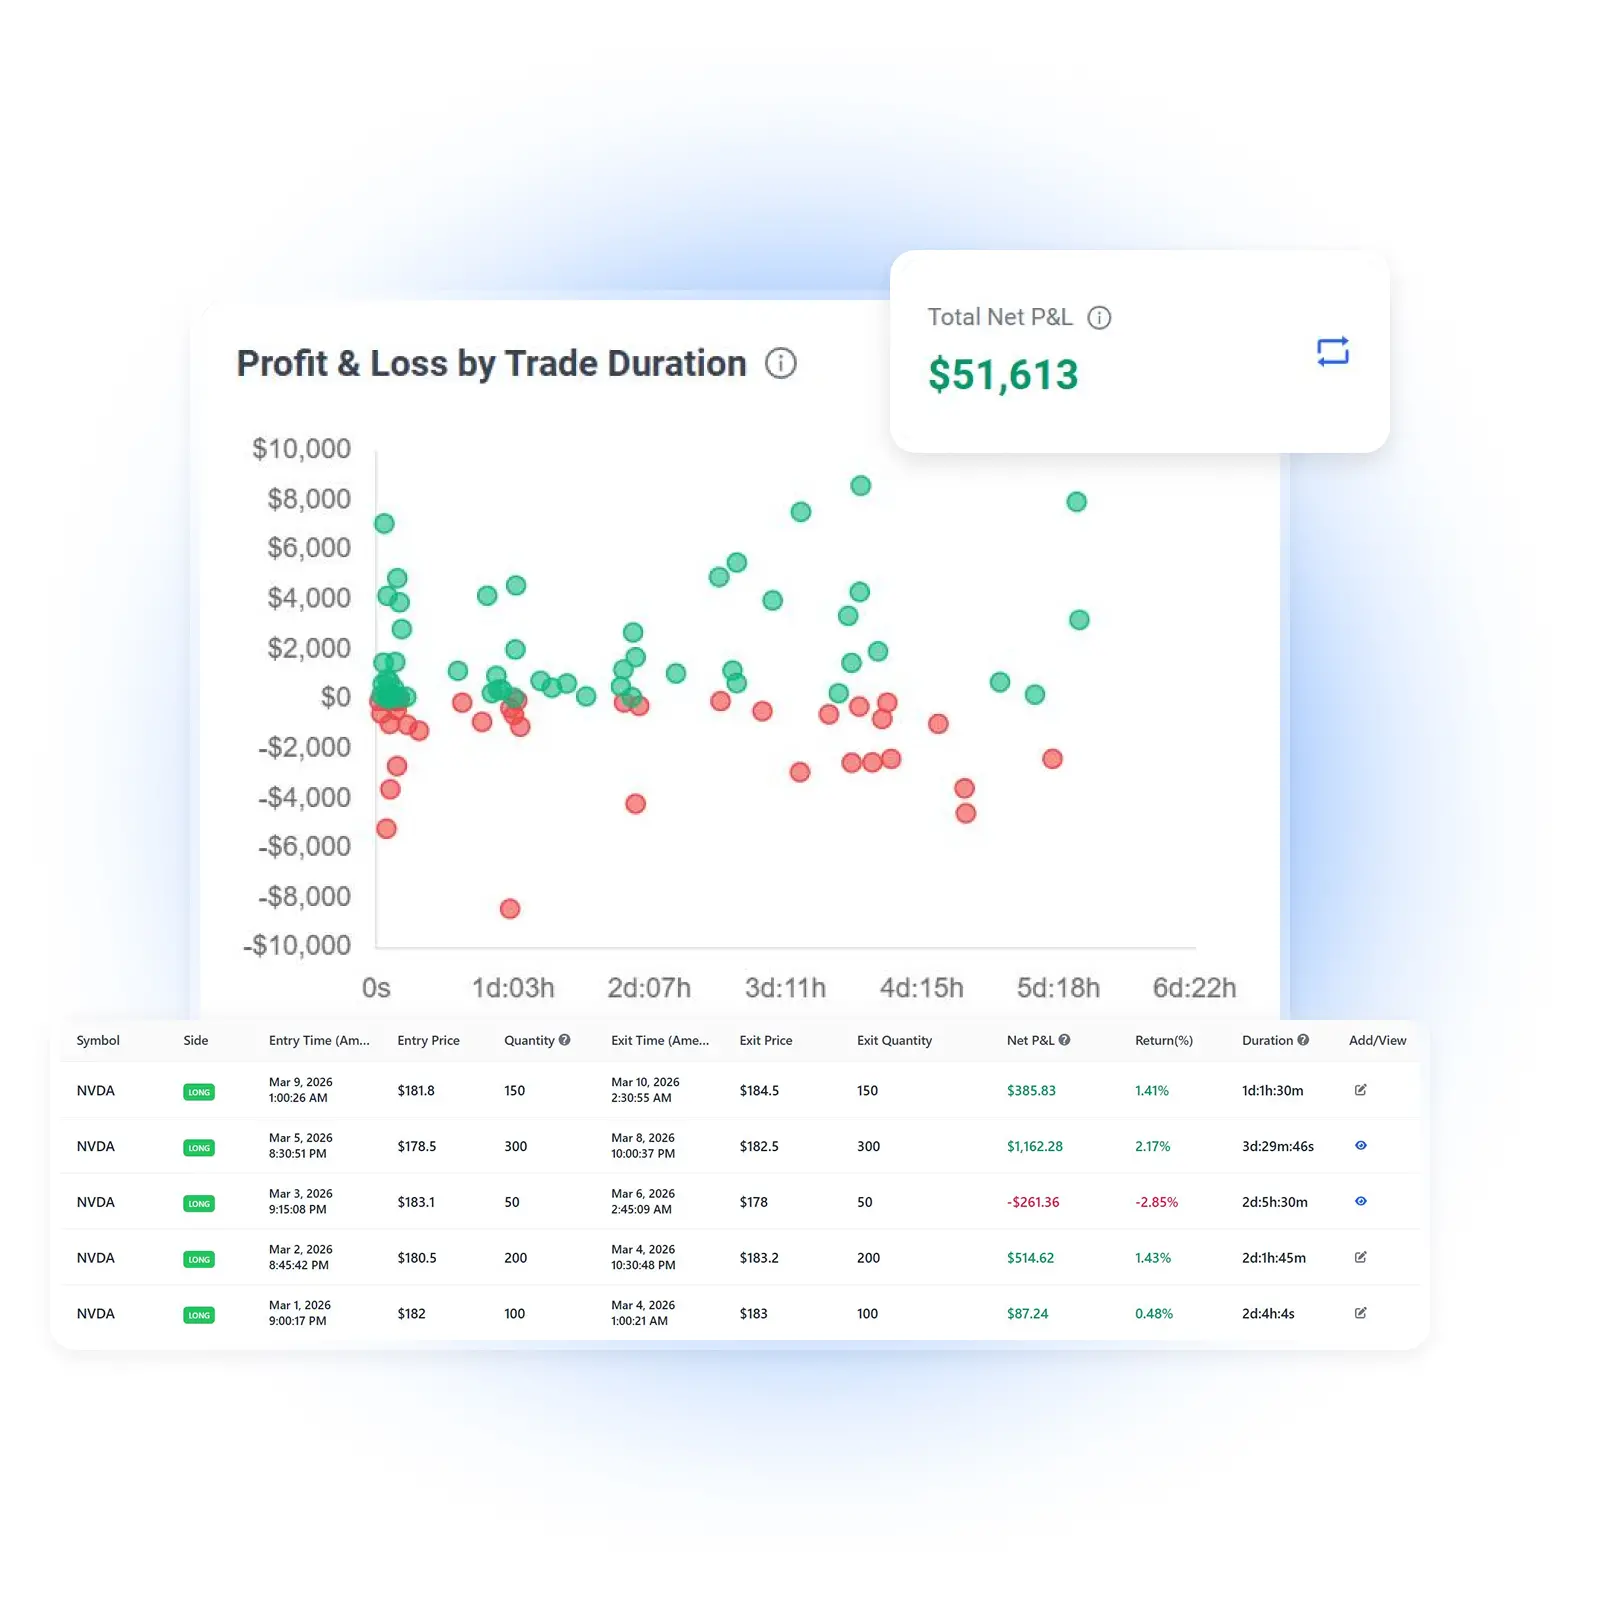
TradeBB helps stock traders review trading performance from multiple perspectives instead of relying only on total profit and loss. Analyze stock symbols, trading setups, execution patterns, strategies, tags, and trading activity to better understand which behaviors and setups are producing consistent results.
Overview Report
Review total P&L, win rate, average trade performance, and overall trading statistics.
Symbols Report
Analyze performance across stock symbols and identify which stocks consistently perform best over time.
Tags Report
Organize stock trades with custom tags to review breakout trades, reversals, earnings plays, momentum setups, and execution patterns.
Trading Calendar
Review daily trading activity, profitability, and high-volume trading days in a calendar view.
Build a structured stock trading review process
1. Import stock trades
Sync your account or upload stock trade history files from your broker or trading platform.
2. Review symbols and setups
Analyze trading performance across stocks, sectors, and trading setups.
3. Organize trading patterns with tags and notes
Track recurring behaviors, execution quality, and trading decisions with custom tags and notes.
4. Review long-term trading consistency
Use reports, dashboards, and calendars to better understand long-term trading performance and behavior.
Built for growing stock trading workflows
Spreadsheets can work for basic stock trade tracking, but reviewing larger trading histories manually becomes difficult over time. TradeBB helps organize stock trade imports, dashboards, notes, reports, strategies, and multi-account workflows in one place.
FAQ
Does TradeBB support stock trade imports?
Yes. TradeBB supports stock trade imports and broker integrations for a wide range of trading platforms and brokers.
Can I upload stock trade history files?
Yes. You can upload supported stock trade history files directly into TradeBB.
Can I track stock trading performance across symbols?
Yes. TradeBB seamlessly handles both long and short equity positions. If you also trade derivatives, you can switch over to our dedicated Options Trading Journal features.
Does TradeBB support multi-account stock trading workflows?
Yes. TradeBB supports reviewing trading activity across multiple trading accounts and broker connections.
Is it safe to upload my broker statements?
Absolutely. Your financial privacy is our priority. Since we do not require live API trading connections, we cannot access your brokerage account or execute trades.
Build a more structured stock trading review process
TradeBB helps stock traders organize trade imports, review setups, analyze symbol performance, and track trading activity across accounts, strategies, tags, and reports — all in one place.
Whether you are reviewing swing trades, momentum setups, earnings plays, or daily trading activity, TradeBB gives you a structured workflow for understanding your trading performance over time.