
The Broker Account Report helps you compare trading performance across all your broker accounts in one place.
If you trade with multiple brokers, funded accounts, or trading platforms, this report makes it easy to see which accounts are performing best and where your trading costs are highest.
You can access it from:
Reports → Broker Accounts
Why Use Broker Account Reports?
Many traders use more than one account.
Examples include:
- Charles Schwab for stocks
- Tradovate for futures
- Interactive Brokers for options
- Multiple funded accounts
- Separate live and demo accounts
Instead of reviewing each account individually, Broker Account Reports provide a consolidated view of account-level performance.
This helps answer questions such as:
- Which broker account generates the most profit?
- Which account has the highest trading costs?
- Which account has the best win rate?
- Are some accounts consistently underperforming?
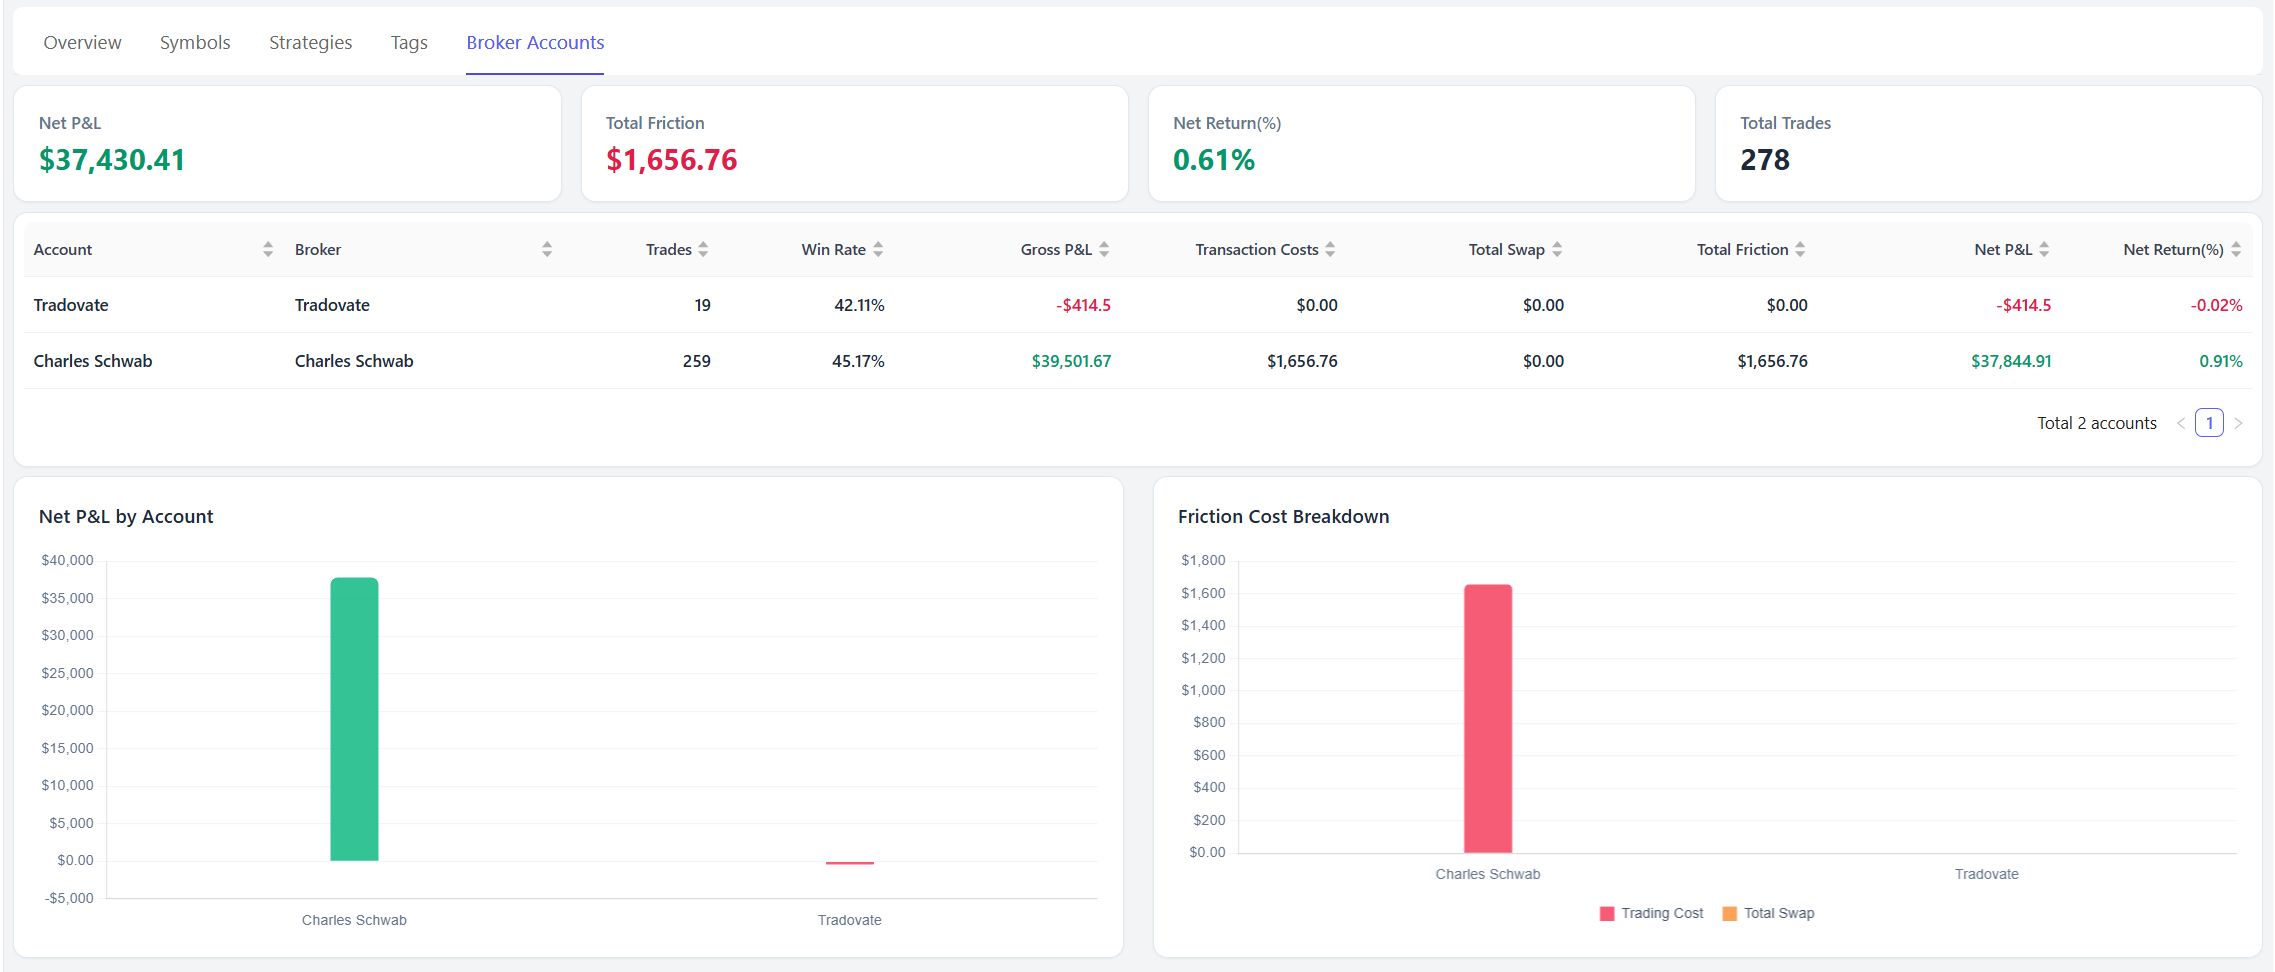
Summary Cards
At the top of the report you'll find several key account-level statistics.
Net P&L
Total net profit or loss across all broker accounts.
This value includes trading costs and reflects your actual realized performance.
Total Friction
Total trading costs across all accounts.
This includes:
- Commissions
- Fees
- Taxes
- Swaps (when applicable)
High friction costs can significantly impact long-term profitability.
Net Return (%)
The overall percentage return generated across all broker accounts.
Total Trades
The total number of trades included in the report.
Broker Account Performance Table
The main table compares each broker account side-by-side.
Account
The account name used within TradeBB.
Examples:
- Charles Schwab
- Tradovate
- Robinhood
- Funded Account #1
Broker
The broker associated with the account.
Trades
The total number of trades imported for the account.
Win Rate
The percentage of profitable trades.
Gross P&L
Profit or loss before trading costs.
Transaction Costs
Total commissions, fees, and taxes charged by the broker.
Total Swap
Total overnight financing or swap costs.
This is most commonly used in Forex and CFD trading.
Total Friction
Combined trading costs.
Formula:
Transaction Costs + Total SwapNet P&L
Profit or loss after all trading costs.
Net Return (%)
Percentage return generated by the account.
Net P&L by Account
This chart compares profitability across all broker accounts.
Green bars indicate profitable accounts.
Red bars indicate losing accounts.
Use this chart to quickly identify:
- Your strongest performing account
- Underperforming accounts
- Accounts that may require review or adjustment
Friction Cost Breakdown
This chart visualizes trading costs by broker account.
The chart includes:
- Trading Costs
- Swap Costs
This can help identify accounts where commissions or financing costs are reducing profitability.
For active traders, trading costs can become a significant factor over time.
How to Use Broker Account Reports
1. Compare Broker Performance
Review Net P&L across accounts to determine which broker or account generates the strongest results.
2. Evaluate Trading Costs
Compare Total Friction across brokers.
Some brokers may appear profitable before costs but perform significantly worse after commissions and fees are considered.
3. Monitor Multiple Trading Accounts
If you manage several accounts, this report provides a quick way to compare performance without switching between accounts.
4. Separate Trading Styles
Many traders use different accounts for different purposes.
Examples:
- Stocks account
- Futures account
- Options account
- Funded account
Broker Account Reports help evaluate whether each account is serving its intended purpose.
5. Identify Accounts That Need Attention
An account with:
- Low Net P&L
- High Friction Costs
- Poor Win Rate
may require strategy adjustments, lower trading frequency, or improved risk management.
Best Practices
To get the most value from Broker Account Reports:
- Import trades for all active accounts
- Keep account names organized
- Review trading costs regularly
- Compare Net P&L instead of Gross P&L
- Monitor both profitability and efficiency
Broker Account Reports help you understand not only how much you're making, but where your trading results are coming from across your entire trading operation.