
The Dashboard gives you a quick overview of your trading performance, risk, consistency, and trading habits. Each widget focuses on a different aspect of your trading data and can help you identify strengths, weaknesses, and areas for improvement.
Key Performance Metrics

① Total Net P&L
Shows your total realized profit or loss after commissions, fees, and taxes.
This is one of the most important metrics because it reflects your actual trading results.
② Win Rate
Shows the percentage of trades that closed with a profit.
A high win rate does not always mean a profitable strategy. Win rate should be analyzed together with Profit Factor and Expectancy.
③ Profit Factor
Measures how much profit you generate for every dollar lost.
- Above 1.0 = profitable
- Above 1.5 = strong
- Above 2.0 = excellent
Profit Factor helps evaluate the overall efficiency of your trading strategy.
④ Per Trade Expectancy
Shows the average amount you can expect to make or lose per trade.
Positive expectancy means your trading approach has a statistical edge over time.
⑤ Average Holding Time
Shows the average duration of your completed trades.
This metric helps identify whether your trading style is primarily:
- Scalping
- Day Trading
- Swing Trading
- Position Trading
Performance Overview
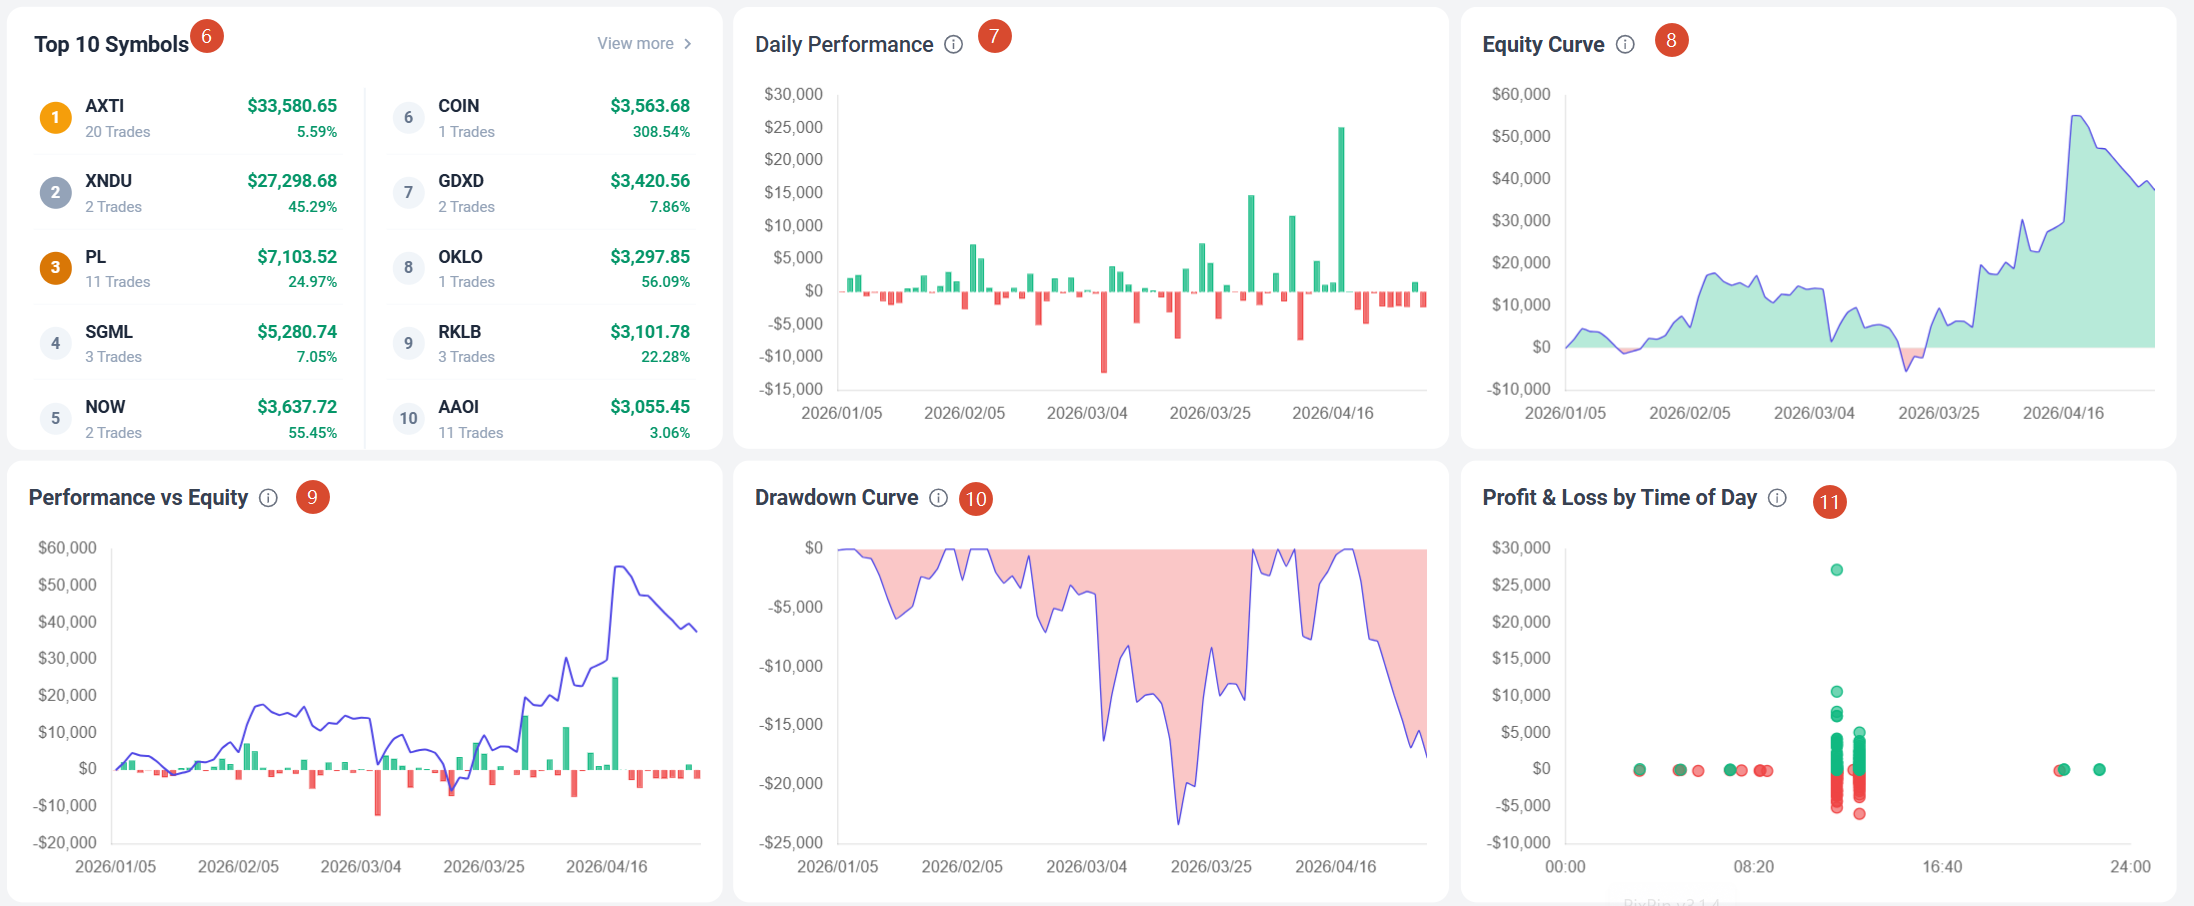
⑥ Top 10 Symbols
Shows your best-performing symbols based on profit and return.
Use this widget to identify markets where you perform consistently well.
⑦ Daily Performance
Displays profit and loss results for each trading day.
This helps identify:
- Consistent trading days
- High volatility periods
- Losing streaks
⑧ Equity Curve
Shows the growth of your trading results over time.
A smooth upward curve generally indicates consistent performance.
Large swings may indicate elevated risk or inconsistent execution.
⑨ Performance vs Equity
Combines daily performance and cumulative results into a single view.
This chart helps you understand how individual trading days contribute to overall account growth.
⑩ Drawdown Curve
Shows the decline from previous equity highs.
Drawdown is one of the most important risk measurements because it reflects how much your account has fallen before recovering.
Smaller drawdowns generally indicate more stable performance.
⑪ Profit & Loss by Time of Day
Shows how your profits and losses are distributed across different trading hours.
Many traders discover that they perform significantly better during specific market sessions.
Trading Behavior Insights
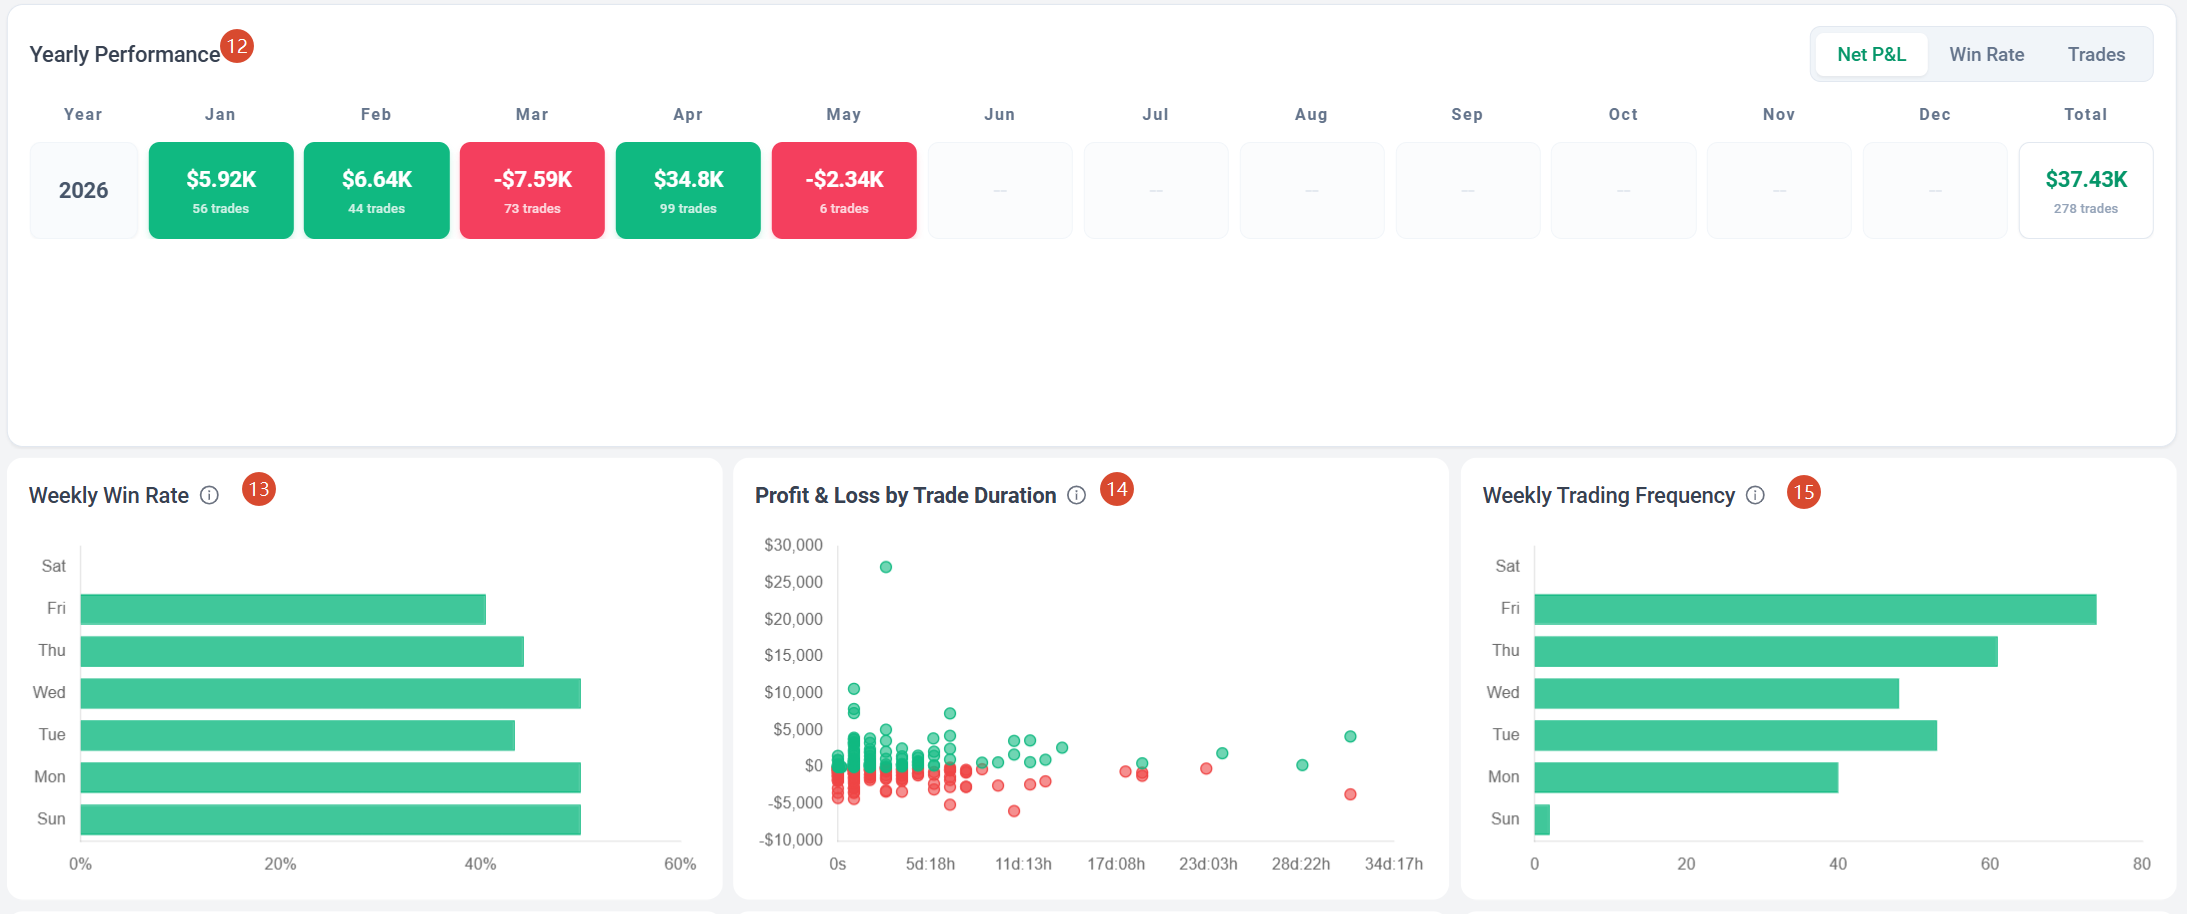
⑫ Yearly Performance
Provides a month-by-month summary of trading results.
Use it to identify:
- Strong months
- Weak months
- Seasonal performance patterns
⑬ Weekly Win Rate
Shows your win rate for each day of the week.
This can reveal whether you consistently perform better on certain trading days.
⑭ Profit & Loss by Trade Duration
Shows the relationship between holding time and profitability.
This helps answer questions such as:
- Do longer trades perform better?
- Are quick trades more profitable?
- Am I holding losers too long?
⑮ Weekly Trading Frequency
Displays how often you trade on each day of the week.
Useful for identifying trading habits and potential overtrading patterns.
Advanced Performance Analysis
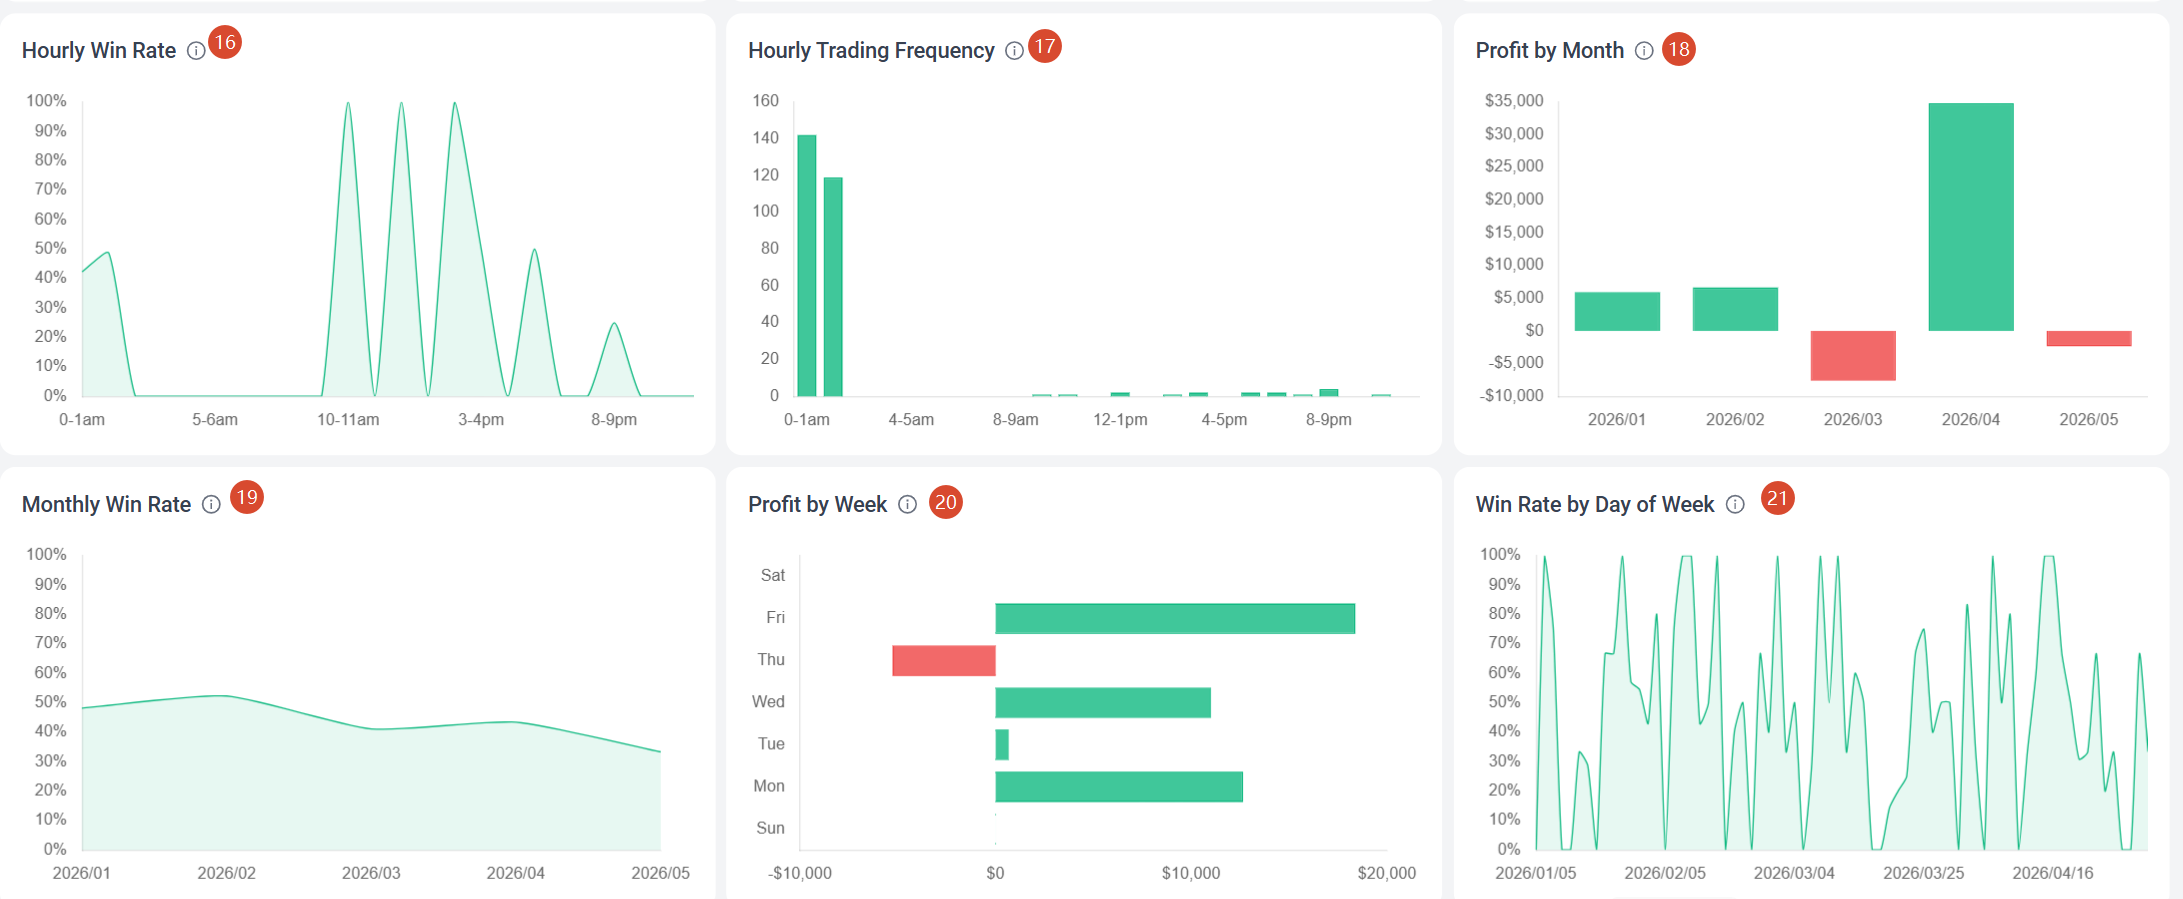
⑯ Hourly Win Rate
Shows your win rate by hour of the day.
Useful for identifying your most successful trading hours.
⑰ Hourly Trading Frequency
Shows when you trade most often throughout the day.
Compare this chart with Hourly Win Rate to determine whether your most active hours are also your most profitable.
⑱ Profit by Month
Displays monthly profit and loss results.
This helps track long-term performance trends.
⑲ Monthly Win Rate
Shows how your win rate changes from month to month.
⑳ Profit by Week
Displays profitability by day of the week.
Use this chart to identify which trading days contribute the most to your overall performance.
㉑ Win Rate by Day of Week
Shows your historical win rate for each trading day.
Combining this chart with Profit by Week can reveal whether higher win rates actually translate into higher profits.
Customizing Your Dashboard
TradeBB allows you to customize your Dashboard layout by rearranging widgets and choosing the metrics that matter most to your trading style.
For detailed instructions, see Customizing Your Dashboard.