
The Tags report helps you analyze trading performance based on the tags assigned to your trades.
Unlike Symbol Reports, which group trades by ticker symbols, or Strategy Reports, which group trades by trading strategies, Tag Reports allow you to measure the impact of behaviors, emotions, mistakes, execution quality, and market conditions on your results.
You can access it from:
Reports → Tags
Before You Begin
The Tags report only includes trades that have been assigned one or more tags.
If your report is empty, you may need to create tags and assign them to your trades first.
👉 Read: How to Use Tags
In that guide you'll learn how to:
- Create tag categories
- Add custom tags
- Assign tags to trades
- Use tags to track behaviors and patterns
- Review tag performance reports
Once tags are assigned to your trades, the Tags report will automatically begin generating statistics.
Why Use Tags?
Tags help answer questions that normal trading statistics cannot.
Examples:
- Which mistakes cost me the most money?
- Does FOMO actually hurt my performance?
- Am I more profitable in trending markets or range-bound markets?
- Which emotional states lead to my best trades?
- What execution mistakes appear most often?
Over time, tags can reveal patterns that are difficult to notice by reviewing trades individually.
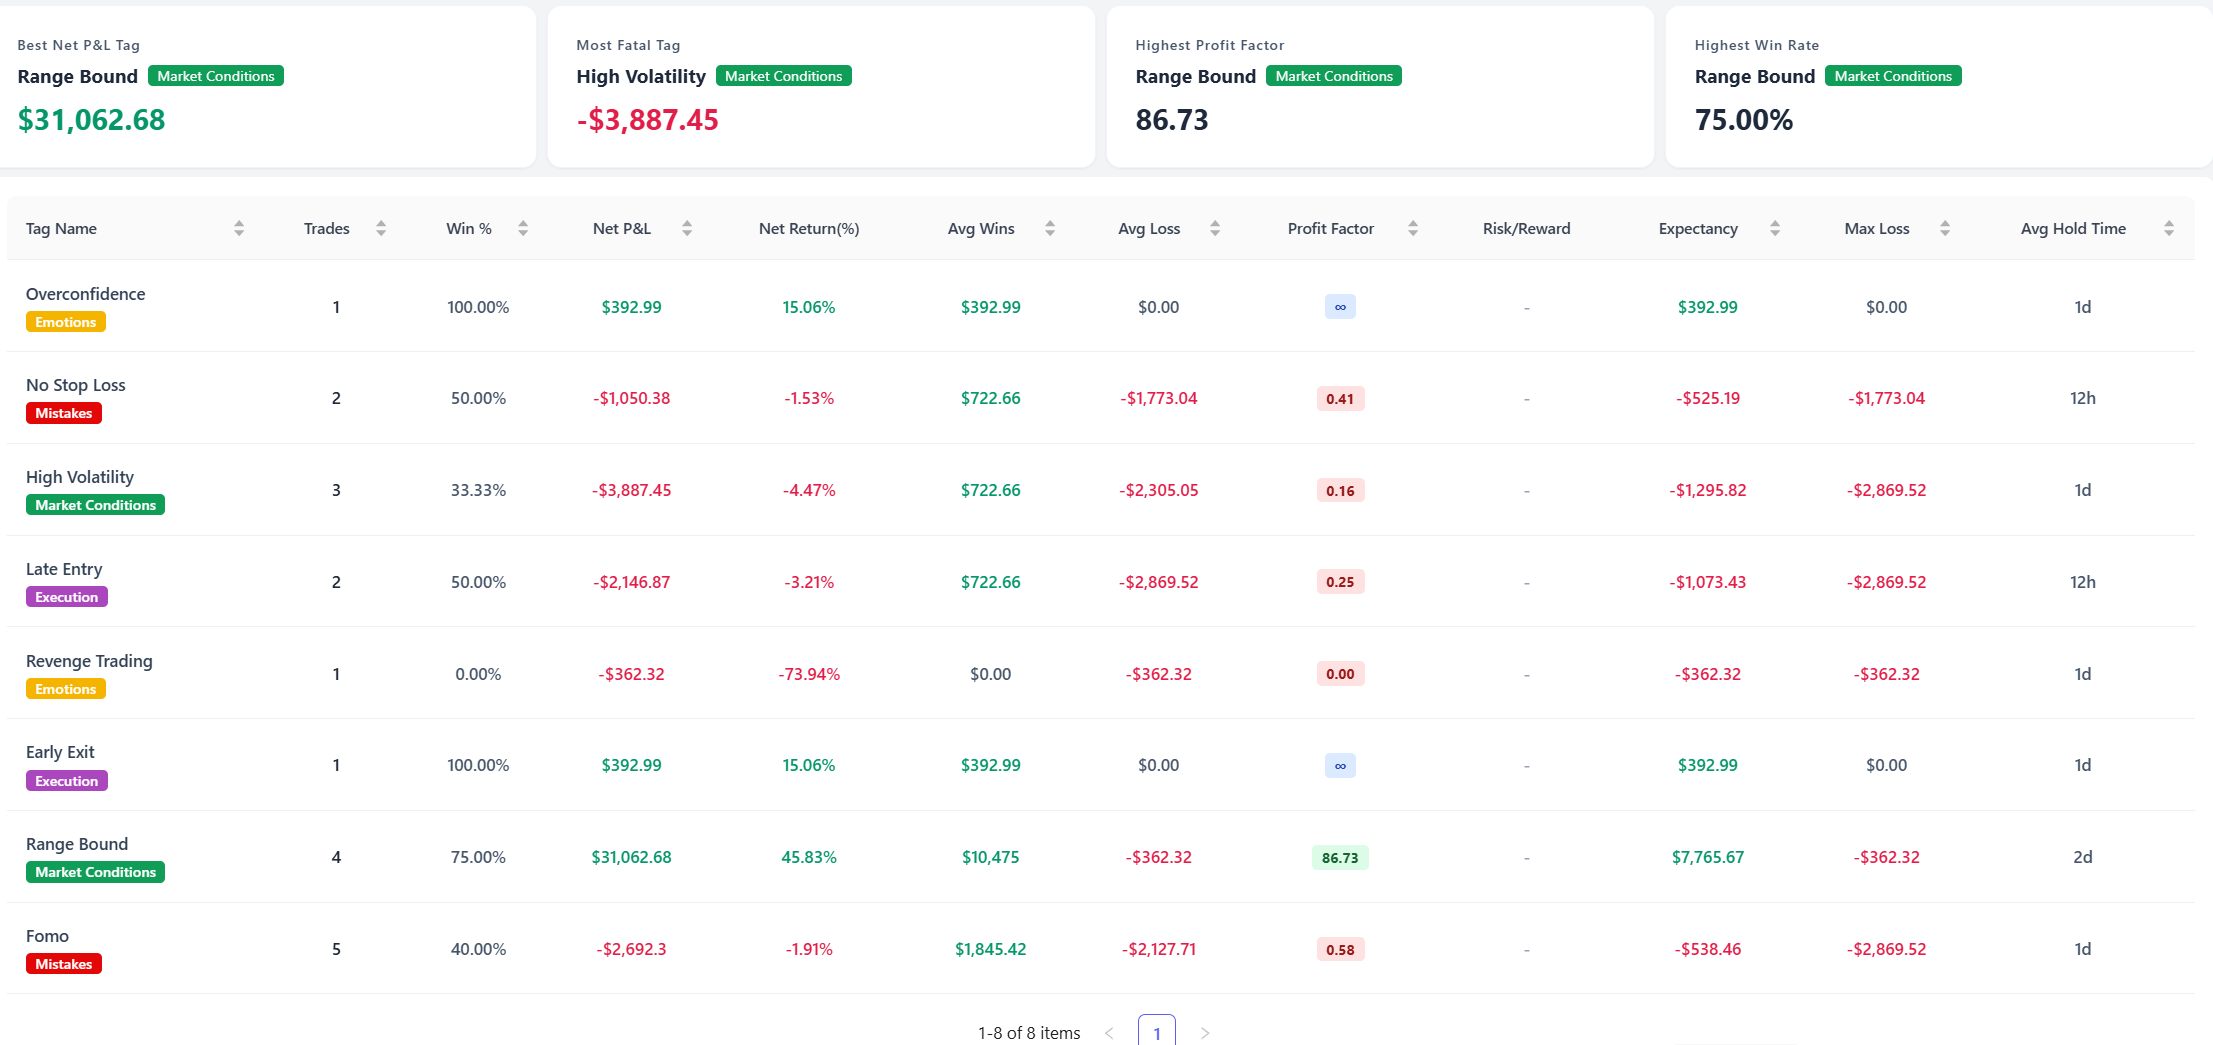
Summary Cards
At the top of the report you'll find several key tag insights.
Best Net P&L Tag
The tag associated with the highest total profit.
This can reveal conditions or behaviors that consistently contribute to positive results.
Most Fatal Tag
The tag associated with the largest net loss.
Many traders discover that a small number of recurring mistakes account for a large portion of their losses.
Highest Profit Factor
The tag with the strongest profit-to-loss ratio.
A high Profit Factor suggests the tagged trades perform exceptionally well.
Highest Win Rate
The tag with the highest percentage of winning trades.
This can help identify market conditions or behaviors that improve consistency.
Tag Performance Table
The main table provides detailed statistics for every tag.
Tag Name
The tag assigned to your trades.
Examples:
- FOMO
- Revenge Trading
- No Stop Loss
- High Volatility
- Trending
- Range Bound
The colored label beneath each tag indicates its category.
Examples:
- Mistakes
- Emotions
- Execution
- Market Conditions
Trades
Total number of trades containing the tag.
Win %
Percentage of winning trades.
Net P&L
Total profit or loss generated by trades using the tag.
Net Return (%)
Percentage return generated by tagged trades.
Avg Wins
Average profit from winning trades.
Avg Loss
Average loss from losing trades.
Profit Factor
The ratio of gross profits to gross losses.
Risk/Reward
The average reward earned relative to the risk taken.
Expectancy
Average expected profit or loss per trade.
Max Loss
Largest single loss recorded among tagged trades.
Avg Hold Time
Average holding duration for trades containing the tag.
Net P&L by Tag
[Insert Tag Performance Chart Screenshot Here]
This chart ranks tags based on profitability.
Green areas represent profitable tags.
Red areas represent losing tags.
Use this chart to quickly identify:
- Behaviors that generate profits
- Habits that consistently lose money
- Market conditions that favor your trading style
For example:
- Range Bound may be highly profitable
- High Volatility may consistently produce losses
These insights can help refine your trading plan.
Trade Frequency by Tag
This chart shows how often each tag appears in your trading history.
A high frequency combined with negative performance may indicate a recurring issue that deserves attention.
For example:
- FOMO appears 50 times
- Net P&L is negative
This suggests FOMO may be one of the biggest contributors to losses.
How to Use the Tag Report
1. Find Expensive Mistakes
Sort by Net P&L to identify tags causing the largest losses.
Common examples include:
- FOMO
- Revenge Trading
- No Stop Loss
- Overconfidence
These often become the highest-impact improvement opportunities.
2. Identify Profitable Conditions
Look for tags with:
- Positive Net P&L
- High Profit Factor
- Strong Expectancy
Examples:
- Trend Following
- Range Bound
- Strong Momentum
These tags may reveal environments where your edge performs best.
3. Analyze Emotional Patterns
Emotion tags can provide valuable self-awareness.
Examples:
- Fear
- Confidence
- Overconfidence
- Hesitation
Review whether specific emotions correlate with stronger or weaker results.
4. Review Execution Quality
Execution tags help evaluate trade management decisions.
Examples:
- Early Exit
- Late Entry
- Chasing
- Missed Setup
Over time you may discover execution errors that repeatedly reduce profitability.
5. Focus on High Frequency Problems
Sometimes a tag does not produce the largest loss but appears extremely often.
These repeated small mistakes can have a significant long-term impact.
The Trade Frequency chart makes these patterns easy to spot.
Best Practices
To get the most value from Tag Reports:
- Use consistent tag names
- Create meaningful tag categories
- Tag trades immediately after closing them
- Review reports regularly
- Focus on patterns instead of individual trades
The goal of Tag Reports is not simply to track performance, but to understand the behaviors, emotions, and market conditions that drive your trading results.