
The Reports section helps you analyze your trading performance from different perspectives. Instead of reviewing trades one by one, Reports organizes your data into meaningful summaries that make it easier to identify strengths, weaknesses, and improvement opportunities.
You can access Reports from the left navigation menu.
At the top of the page, you can also use filters such as:
- Date Range
- Broker Account
- Advanced Filters
These filters apply across all report tabs, allowing you to focus on a specific period, account, strategy, symbol, or trading setup.
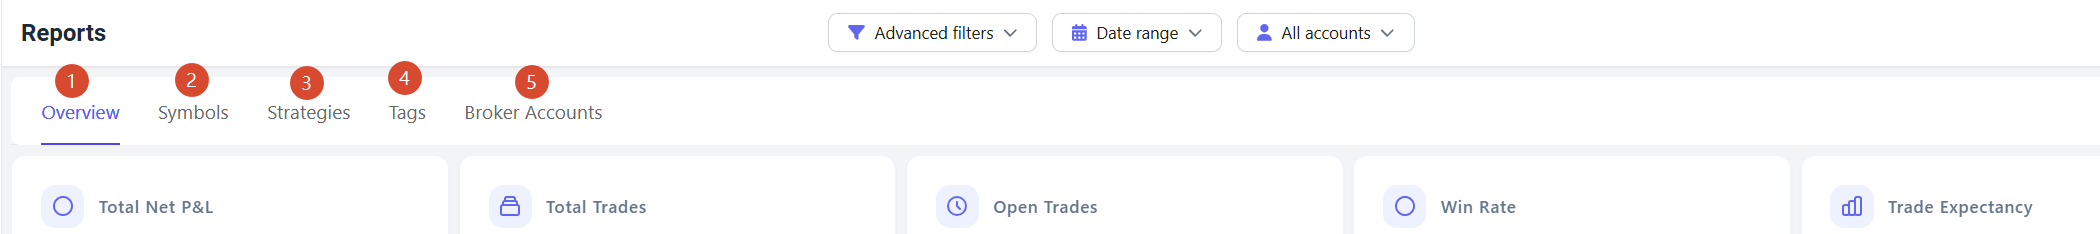
Overview
The Overview report provides a high level summary of your trading performance.
It includes key metrics such as:
- Net P&L
- Win Rate
- Trade Expectancy
- Profit Factor
- Holding Time
- Trading Costs
This is usually the best place to start when reviewing your performance.
Symbols
The Symbols report groups trades by instrument or ticker symbol.
Use this report to answer questions such as:
- Which symbols generate the most profit?
- Which symbols have the highest win rate?
- Which symbols consistently lose money?
- Am I trading too many different instruments?
This report helps identify your strongest and weakest markets.
Strategies
The Strategies report groups trades based on the trading strategy assigned to each trade.
Examples may include:
- Breakout
- Trend Following
- Swing Trading
- Range Trading
This report helps you understand which trading approaches perform best over time.
If you are not currently using strategies, learn more in the Strategies section of Settings.
Tags
The Tags report groups trades using custom tags.
Tags can be used to track:
- Trading mistakes
- Market conditions
- Emotional states
- Execution quality
- Custom trading observations
Examples include:
- FOMO
- Overtrading
- Fear
- Trending Market
- Poor Entry
This report helps uncover patterns that may not be visible through symbols or strategies alone.
Broker Accounts
The Broker Accounts report compares performance across multiple trading accounts.
Use this report to evaluate:
- Account profitability
- Win rate by account
- Trading activity by account
- Performance differences between brokers
This is especially useful if you trade through multiple brokers or maintain separate accounts for different trading styles.
Recommended Review Workflow
For most traders, the following review process works well:
- Start with Overview to evaluate overall performance.
- Review Symbols to identify your best and worst instruments.
- Analyze Strategies to understand which setups perform best.
- Examine Tags to discover behavioral patterns and recurring mistakes.
- Compare Broker Accounts if you trade across multiple accounts.
By reviewing reports regularly, you can make data driven improvements and build a more consistent trading process.