
The Overview report provides a complete summary of your trading performance during the selected date range. It combines profitability, win rate, trade statistics, holding time, costs, and risk metrics into a single view, making it the best place to review your overall trading performance.
You can access it by navigating to:
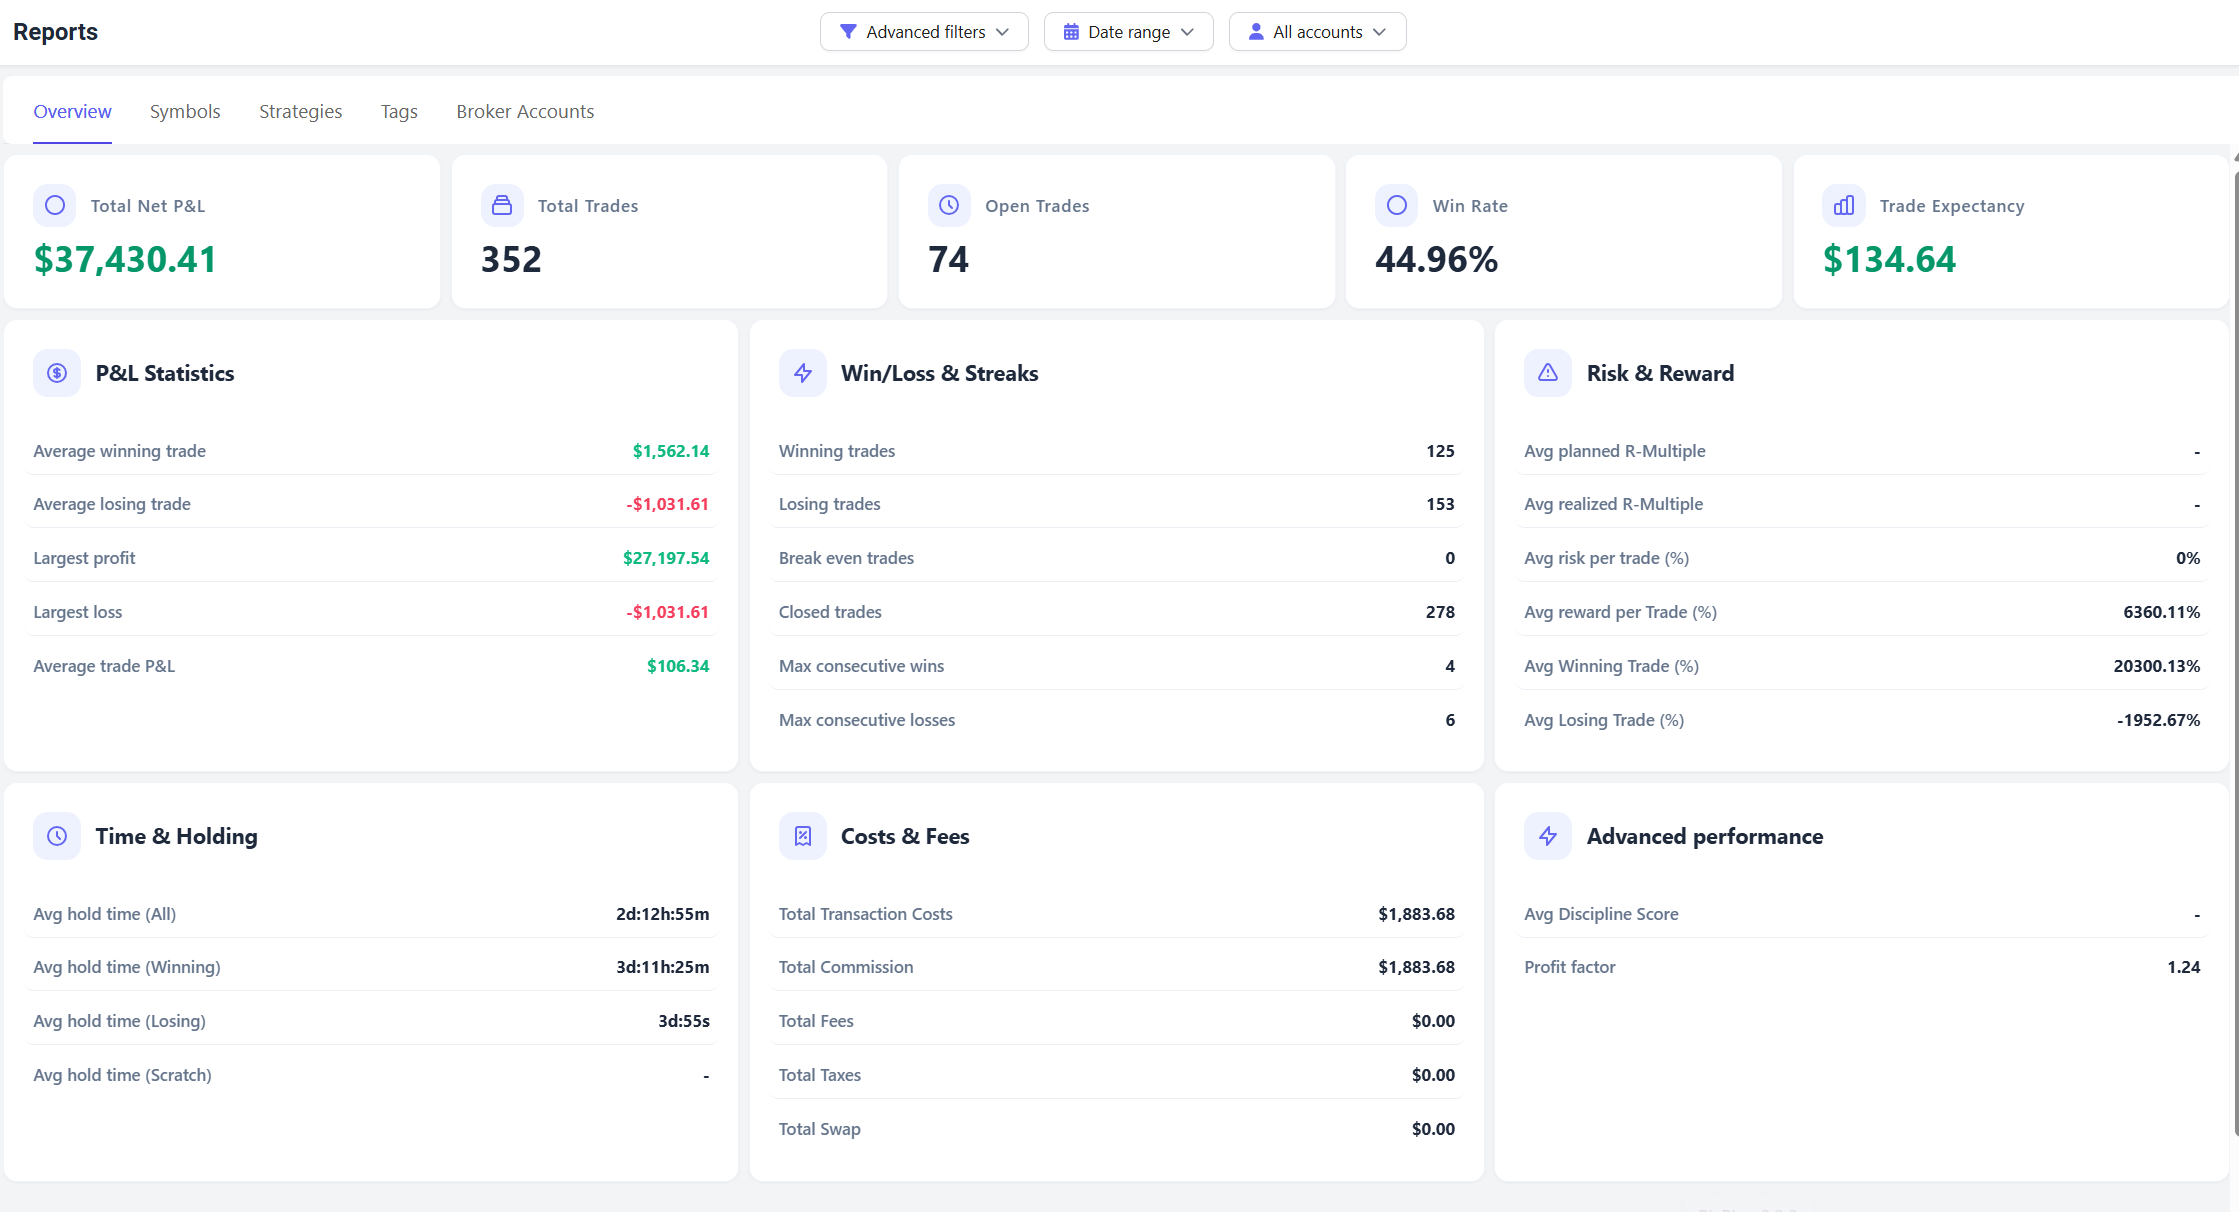
Reports → Overview
Before reviewing your metrics, make sure you've selected the correct date range, broker account, and filters at the top of the page.
Top Summary Metrics
At the top of the Overview report, you'll find five key performance indicators that provide a quick snapshot of your performance.
Total Net P&L
Your total realized profit or loss after commissions, fees, and taxes.
This is typically the first metric traders review when evaluating overall performance.
Total Trades
The total number of trades included in the selected date range.
Open Trades
The number of trades that are currently open and not yet fully closed.
Win Rate
The percentage of closed trades that resulted in a profit.
Formula
Win Rate = Winning Trades ÷ Closed Trades × 100
Trade Expectancy
The average amount you can expect to make or lose per trade.
A positive expectancy generally indicates that your trading approach has a long-term statistical edge.
P&L Statistics
The P&L Statistics section focuses on trade profitability.
Average Winning Trade
The average profit from all winning trades.
Average Losing Trade
The average loss from all losing trades.
Largest Profit
Your most profitable trade during the selected period.
Largest Loss
Your largest losing trade during the selected period.
Average Trade P&L
The average profit or loss generated per closed trade.
Win/Loss & Streaks
This section helps you evaluate consistency.
Winning Trades
Total number of profitable trades.
Losing Trades
Total number of losing trades.
Break Even Trades
Trades that closed with little or no profit or loss.
Closed Trades
Total completed trades.
Max Consecutive Wins
Your longest winning streak.
Max Consecutive Losses
Your longest losing streak.
Tracking streaks can help identify periods of strong performance or emotional trading behavior.
Risk & Reward
The Risk & Reward section evaluates how efficiently you manage risk.
Depending on the data available in your account, you may see:
Avg Planned R-Multiple
Average planned reward relative to risk.
Avg Realized R-Multiple
Average realized reward relative to risk after trades are closed.
Avg Risk Per Trade (%)
Average percentage of capital risked per trade.
Avg Reward Per Trade (%)
Average percentage return generated per trade.
Avg Winning Trade (%)
Average percentage gain from winning trades.
Avg Losing Trade (%)
Average percentage loss from losing trades.
Time & Holding
This section measures how long positions are held.
Avg Hold Time (All)
Average holding time across all trades.
Avg Hold Time (Winning)
Average holding time for profitable trades.
Avg Hold Time (Losing)
Average holding time for losing trades.
Avg Hold Time (Scratch)
Average holding time for break-even trades.
Comparing these values can reveal whether you're cutting winners too early or holding losers too long.
Costs & Fees
Trading costs can significantly impact performance over time.
Total Transaction Costs
Combined trading costs during the selected period.
Total Commission
Total commissions paid to brokers.
Total Fees
Additional exchange, platform, or regulatory fees.
Total Taxes
Taxes included in imported trade data.
Total Swap
Overnight financing charges, commonly associated with forex and CFD positions.
Advanced Performance
This section contains additional performance metrics.
Discipline Score
A proprietary metric designed to measure consistency and adherence to your trading process.
Availability may depend on the data available in your account.
Profit Factor
One of the most widely used trading performance metrics.
Formula
Profit Factor = Gross Profit ÷ Gross Loss
General interpretation:
- Below 1.0 = Losing strategy
- Around 1.0 = Break-even
- Above 1.5 = Generally healthy
- Above 2.0 = Strong performance
How to Use the Overview Report
A simple review workflow is:
- Start with Total Net P&L and Win Rate.
- Review Trade Expectancy and Profit Factor.
- Compare Average Winning Trade versus Average Losing Trade.
- Check trading costs and holding times.
- Analyze streaks and consistency metrics.
The Overview report is designed to help you quickly understand what's working, what's not, and where you can improve your trading performance.