
The Symbols report helps you analyze trading performance by instrument or ticker symbol.
Instead of reviewing trades individually, this report groups all trades for the same symbol together, making it easier to identify which markets, stocks, futures contracts, or currency pairs contribute most to your profits and losses.
You can access it by navigating to:
Summary Cards
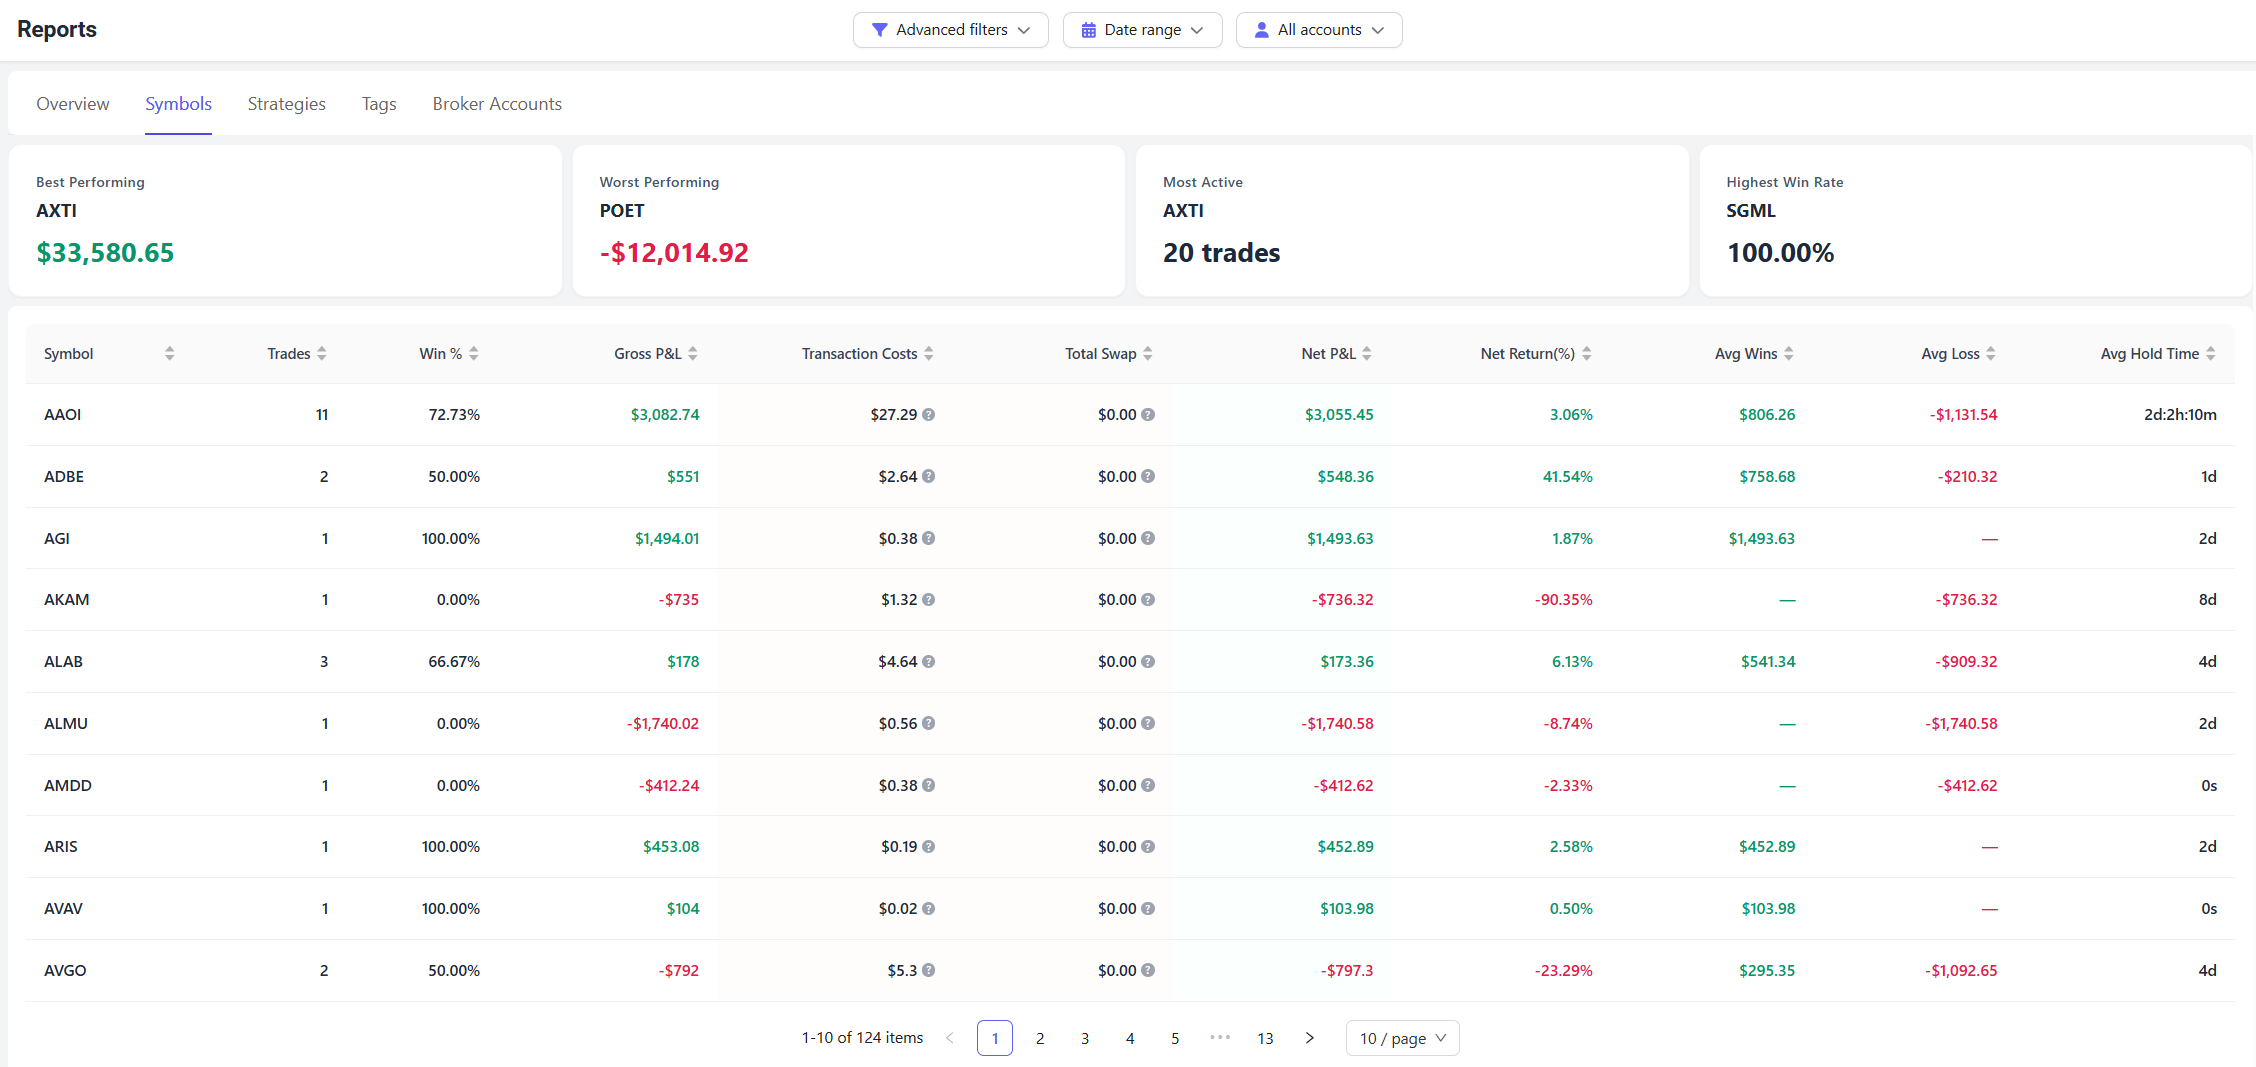
At the top of the page, you'll find several summary metrics that highlight the most important symbol-level insights.
Best Performing
The symbol with the highest Net P&L during the selected period.
This helps identify your strongest market.
Worst Performing
The symbol with the lowest Net P&L during the selected period.
This can help uncover recurring mistakes or markets that may not fit your trading style.
Most Active
The symbol with the highest number of trades.
A high trade count may indicate strong familiarity with that instrument or potential overtrading.
Highest Win Rate
The symbol with the highest percentage of profitable trades.
Keep in mind that a high win rate does not always mean high profitability.
Symbol Performance Table
The table provides detailed statistics for every traded symbol.
Symbol
The instrument or ticker symbol.
Examples:
- AAPL
- NVDA
- MES
- MNQ
- EURUSD
Trades
The total number of trades executed for that symbol.
Win %
The percentage of profitable trades.
Gross P&L
Profit or loss before commissions, fees, taxes, and other trading costs.
Transaction Costs
Total commissions, fees, and taxes associated with that symbol.
Total Swap
Total overnight financing charges or swap costs.
This metric is most commonly used in forex and CFD trading.
Net P&L
Profit or loss after all trading costs have been deducted.
This is generally the most important profitability metric.
Net Return (%)
Percentage return generated by that symbol.
Avg Wins
Average profit from winning trades.
Avg Loss
Average loss from losing trades.
Avg Hold Time
Average amount of time positions were held before being closed.
Symbol Performance Charts
The Symbols report also includes visual charts that help you quickly identify trends and opportunities.
[Insert Symbol Charts Screenshot Here]
Net P&L by Symbol
This chart ranks symbols based on profitability.
Green symbols represent profitable instruments.
Red symbols represent losing instruments.
Use this chart to quickly identify:
- Your most profitable symbols
- Your weakest symbols
- Whether profits are concentrated in a small number of instruments
Trades & Costs Impact
This chart compares:
- Number of trades
- Trading costs
for each symbol.
It helps answer questions such as:
- Which symbols generate the highest commissions?
- Which symbols are traded most frequently?
- Are trading costs reducing profitability?
How to Use the Symbols Report
A simple review process is:
- Identify your best performing symbols.
- Review your worst performing symbols.
- Compare win rates and profitability.
- Examine trading costs.
- Evaluate average hold times.
- Focus more attention on markets where you consistently perform well.
Over time, many traders discover that a small number of symbols generate most of their profits. The Symbols report helps uncover those patterns and supports more informed trading decisions.