 TradeBB
Max drawdown: what it is and how to calculate it

Max drawdown is the biggest drop your account takes from a high point to a low point, before it makes a new high. It answers one question: at your worst stretch, how much of your gains did you give back?
It's usually written as a percentage of the peak:
Most explanations use a fund falling from $100 million to $50 million. This one uses a trader's own trades, because that's where the number is useful: it tells you how deep your bad runs go, and whether the next one could take you somewhere you can't afford.
How to calculate max drawdown, trade by trade
You need one column of numbers: the profit or loss of each trade, in order. Then:
- Running total — add each trade's result to the previous total
- Highest point so far — after each trade, the highest running total you've reached
- Drawdown — running total minus highest point so far
- Max drawdown — the most negative number in that drawdown column
Here are 12 trades on a $10,000 account:
| Trade | P&L | Running total | Highest so far | Drawdown |
|---|---|---|---|---|
| 1 | +$120 | $120 | $120 | $0 |
| 2 | +$80 | $200 | $200 | $0 |
| 3 | −$60 | $140 | $200 | −$60 |
| 4 | −$150 | −$10 | $200 | −$210 |
| 5 | +$40 | $30 | $200 | −$170 |
| 6 | −$90 | −$60 | $200 | −$260 |
| 7 | +$200 | $140 | $200 | −$60 |
| 8 | +$60 | $200 | $200 | $0 |
| 9 | −$110 | $90 | $200 | −$110 |
| 10 | −$70 | $20 | $200 | −$180 |
| 11 | −$40 | −$20 | $200 | −$220 |
| 12 | +$180 | $160 | $200 | −$40 |
The max drawdown is −$260: from a balance of $10,200 after trade 2 down to $9,940 after trade 6. As a percentage of the peak, that's 2.5%.
Two things the table shows that the single number doesn't:
- You were up overall the whole time it hurt. The 12 trades end $160 ahead. A drawdown measures distance from your best point, not from where you started.
- The second dip almost matched the first. Trades 9 to 11 fell $220 and hadn't recovered by trade 12. Max drawdown only reports the deepest one.
Trade by trade or day by day: why the same trades give different answers
Group those 12 trades into three days of four, and measure only at each day's close:
| Day | Trades | Closing total | Highest close so far | Drawdown at the close |
|---|---|---|---|---|
| 1 | 1–4 | −$10 | $0 (start) | −$10 |
| 2 | 5–8 | $200 | $200 | $0 |
| 3 | 9–12 | $160 | $200 | −$40 |
Measured at the close, the max drawdown is −$40. Measured trade by trade, it was −$260. Same trades.
The daily view hides what happened inside a day: on day 1, the account was up $200 by the second trade and finished down $10. On day 2, it fell to −$60 before climbing back to $200. Neither shows up in closing numbers.
Neither view is wrong. The daily one tells you how your days end. The trade-by-trade one tells you how far a run of trades can take you before it turns, which is the number that matters if you size up after losses or trade under a daily loss limit.
One limit applies to both: a journal built from your closed trades sees your balance after each trade, not the lowest point a trade reached while it was still open. Your real worst moment was probably a little deeper.
What counts as a good max drawdown?
There's no number that's good for everyone. A drawdown that's normal for a swing trader holding for weeks would end a prop evaluation. What you can do is compare it to things that are yours:
- Your risk per trade. If you risk $100 a trade, a $260 drawdown is 2.6 times your risk, often written 2.6R. A drawdown in R tells you how many average losses deep you went, and it compares fairly across account sizes.
- Your losing streaks. Multiply your longest losing streak by your average loss. If your max drawdown is far beyond that, something besides normal losing made it worse, often bigger trades after losses.
- The limit you can't cross. If you trade an evaluation or have your own stop-trading line, how much of that room did your worst stretch use?
And look at how long it lasted, not just how deep. Two traders with the same max drawdown are in different places if one recovered in a week and the other is still under after three months.
The math of getting back
A drawdown takes more to undo than it took to lose, because you're climbing back from a smaller balance:
| Drawdown | Gain needed to get back to the peak |
|---|---|
| 10% | 11.1% |
| 20% | 25% |
| 30% | 42.9% |
| 50% | 100% |
That's why the trades right after a deep drawdown are the most dangerous ones to take bigger. More on that pattern in revenge trading.
Max drawdown isn't always the same thing
The term gets used four ways, and mixing them up causes most of the confusion:
- A measurement — the deepest fall your account actually took. That's this article.
- A limit you set in advance — some traders call their "stop trading if I'm down this much" line their max drawdown.
- A prop firm rule — evaluation accounts have a maximum loss, often called max drawdown, and many of them trail your highs. That works differently; see trailing drawdown, explained step by step.
- A fund term — in private funds, a "drawdown" can also mean investors' committed money being called in. Unrelated to trading losses.
Find your max drawdown without a spreadsheet
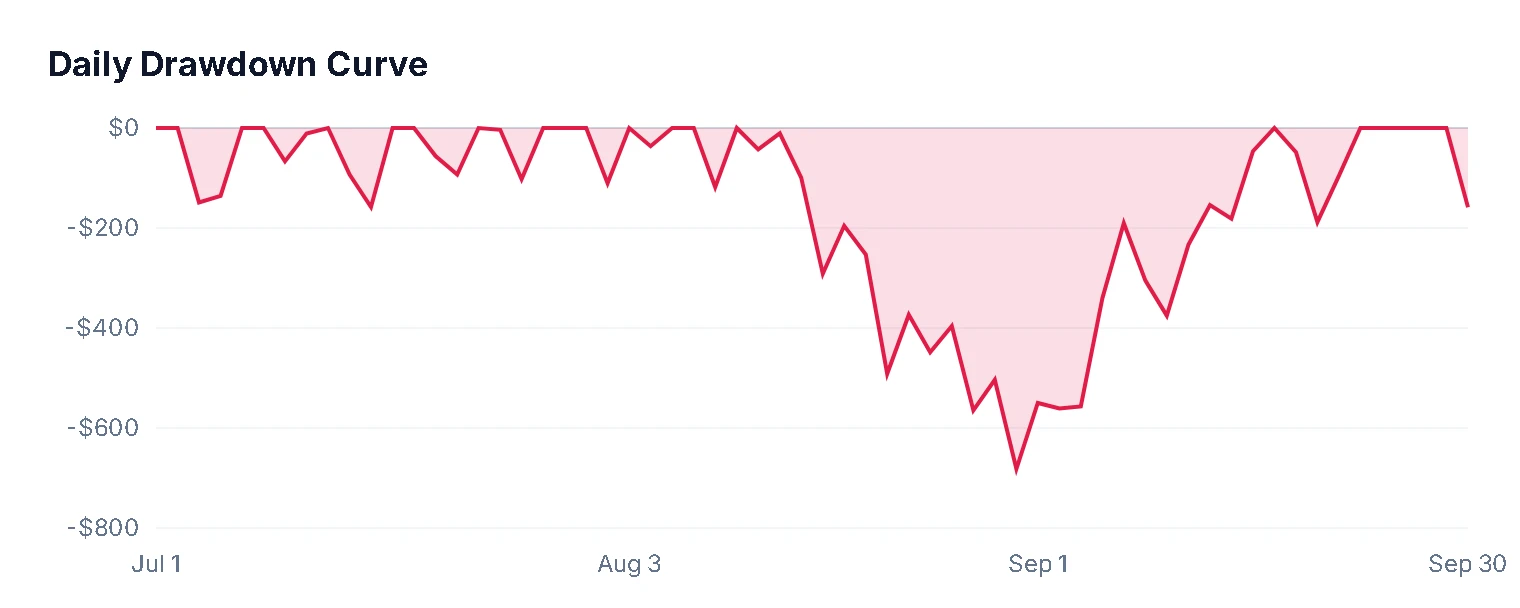
The number tells you how deep. Your trading journal tells you why: open the calendar on the days the curve bottomed out, and the Daily Journal card lists the trades behind them. Tag what happened on those trades, and the Tags report shows which setups or habits keep showing up in your worst stretches.
Frequently asked questions
The largest drop in your account from a high point to a later low point, before a new high. It shows how much you gave back during your worst stretch.
The largest drop in your account from a high point to a later low point, before a new high. It shows how much you gave back during your worst stretch.
Keep a running total of your trade results and track the highest point it has reached. After each trade, subtract that high from the running total. The most negative result is your max drawdown. As a percentage: (lowest value − peak value) ÷ peak value.
Keep a running total of your trade results and track the highest point it has reached. After each trade, subtract that high from the running total. The most negative result is your max drawdown. As a percentage: (lowest value − peak value) ÷ peak value.
Either. Dollars are easier to read on one account; percent, or multiples of your risk per trade, are better for comparing accounts of different sizes.
Either. Dollars are easier to read on one account; percent, or multiples of your risk per trade, are better for comparing accounts of different sizes.
It depends on what it's built from. A drawdown calculated from closed trades only sees your balance after each trade closes, so the real low point, while a losing trade was still open, may have been deeper.
It depends on what it's built from. A drawdown calculated from closed trades only sees your balance after each trade closes, so the real low point, while a losing trade was still open, may have been deeper.
No. Max drawdown is something you measure after the fact. A prop firm's limit is a rule you can't cross, and it often moves up with your highs. See trailing drawdown.
No. Max drawdown is something you measure after the fact. A prop firm's limit is a rule you can't cross, and it often moves up with your highs. See trailing drawdown.
Know how deep your worst run goes, and what was in it.
Bring in your trades and see your max drawdown, trade by trade and day by day.