 TradeBB
Risk reward ratio: how to calculate it, and what makes one good

The risk reward ratio compares how much a trade can lose with how much it can make. Risk $100 to make $200, and the ratio is 1:2.
Risk reward ratio = Risk ÷ Reward, usually written as 1 : (Reward ÷ Risk)
You'll also see it written the other way round, as 2:1, putting the reward first. Same trade, same meaning. This article always puts risk first.
A ratio on its own doesn't tell you whether a strategy makes money. It does once you put it next to your win rate, and after that, next to what your trades actually did.
How to calculate the risk reward ratio
You need three prices: where you enter, where your stop is, and where your target is.
Long trade: Risk = Entry − Stop. Reward = Target − Entry. Short trade: Risk = Stop − Entry. Reward = Entry − Target.
| Stock, long | EUR/USD, short | Micro S&P futures, long | |
|---|---|---|---|
| Entry | $50.00 | 1.1750 | 6,450 |
| Stop | $48.50 | 1.1780 | 6,442 |
| Target | $54.50 | 1.1690 | 6,466 |
| Risk | $1.50 a share | 30 pips | 8 points ($40 a contract) |
| Reward | $4.50 a share | 60 pips | 16 points ($80 a contract) |
| Ratio | 1:3 | 1:2 | 1:2 |
The ratio is the same whether you count in dollars, pips or points, so you can work it out before you know your position size. The dollar amount matters for something else: whether a full loss fits the risk you allow per trade.
Fill in for your next trade:
Direction ___ Entry ___ Stop ___ Target ___ → Risk ___ Reward ___ → Ratio 1 : ___
Or use the risk reward ratio calculator, which also shows your break-even win rate with costs included.
What is a good risk reward ratio?
It depends on how often you win. Every ratio has a break-even win rate: the win rate at which you neither make nor lose money.
| Ratio | Break-even win rate |
|---|---|
| 1:1 | 50% |
| 1:1.5 | 40% |
| 1:2 | 33.3% |
| 1:3 | 25% |
| 1:4 | 20% |
So a good ratio is one your win rate beats by a comfortable margin. A 1:4 ratio is good if you win more than one trade in five, and a losing strategy if you don't. A 1:1 ratio is fine for a trader who wins 60% of the time.
There's a trade-off between the two. Set targets further away and they get hit less often. A bigger ratio only helps if the extra reward on the winners you keep outweighs the winners you lose. The only way to know is to check your own trades.
Costs move your break-even line
The table above assumes trading is free. It isn't.
Say you risk $100 to make $200 (1:2), and commissions plus slippage cost $10 a trade. A winner now nets $190 and a loser costs $110. Your break-even win rate moves from 33.3% to 36.7%.
The smaller your targets, the bigger this effect: on a 1:1 trade risking $20, the same $10 cost moves break-even from 50% to 75%.
So calculate your ratio, and later your results, after costs.
The number that tells you if it works: expectancy
The risk reward ratio is a plan for one trade. Expectancy is what your trades actually earn on average:
At 1:2 with a 40% win rate, measured in units of risk (R): 0.4 × 2R − 0.6 × 1R = +0.2R per trade. Risking $100 a trade, that's $20 a trade on average, before costs.
Expectancy and profit factor answer the same question in different units: whether your winners outweigh your losers. Neither shows how rough the ride was; for that, look at max drawdown.
Planned vs realized: is your ratio what you actually get?
The ratio you plan and the result you get are different numbers. The result, measured in units of the risk you planned, is called the R-multiple: a trade that risked $100 and made $150 is +1.5R; one that lost $130 is −1.3R.
Take a EUR/USD long: entry 1.17420, stop 1.17320, target 1.17620. That's 10 pips of risk for 20 pips of reward, 1:2. It closed at 1.17532, 11.2 pips up: +1.12R. Profitable, and a little over half of what was planned.
One trade like that is noise. If your average realized R sits well below your planned ratio across many trades, your break-even win rate is higher than you think. A plan of 1:2 that you actually trade at 1:1.1 needs to win 48% of the time, not 33%. Worth knowing before you pay for a prop firm evaluation, where reaching the profit target depends on your winners paying what you planned.
Find where your reward goes
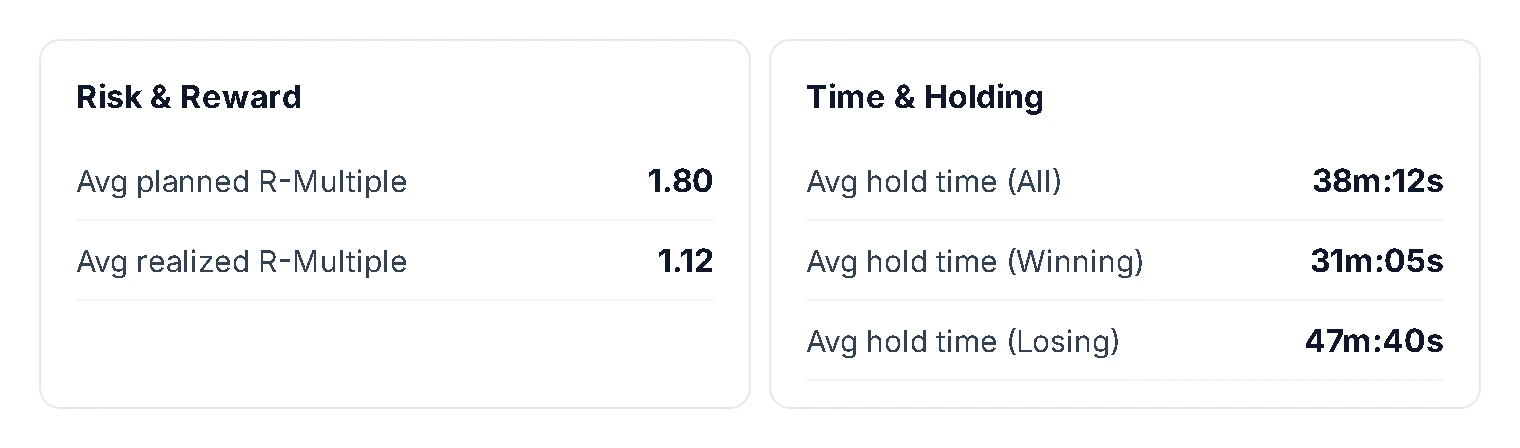
- Hold times. Overview splits average hold time into winning and losing trades. Winners closed much faster than losers often means profits cut short while losses get room.
- Tags. The Tags report shows risk/reward and expectancy for every tag. Tag early exits or moved stops when they happen, and you'll see what each one does to your realized R.
- The trades themselves. Filter your trades by planned and realized R-multiple, for example trades planned at 2R or more that realized under 1R, and read them one by one.
In the sample account below, the plan averages 1.80R and trades realize 1.12R, with winners held about 31 minutes and losers about 48. That gap is the first thing to look at.
Frequently asked questions
Usually, yes. Both describe risking 1 to make 2; they just put the numbers in a different order. Check which one a source puts first.
Usually, yes. Both describe risking 1 to make 2; they just put the numbers in a different order. Check which one a source puts first.
One your win rate beats after costs. Day traders often trade smaller targets, so costs take a bigger share; work out your break-even win rate with costs included.
One your win rate beats after costs. Day traders often trade smaller targets, so costs take a bigger share; work out your break-even win rate with costs included.
It can be, if you win more than half your trades after costs.
It can be, if you win more than half your trades after costs.
The ratio is the plan, set before you enter. The R-multiple is the result, measured after you exit, in units of the risk you planned.
The ratio is the plan, set before you enter. The R-multiple is the result, measured after you exit, in units of the risk you planned.
If a setup's realized results don't beat its break-even win rate, it's costing you money. Check that from your own trades rather than with a fixed cutoff.
If a setup's realized results don't beat its break-even win rate, it's costing you money. Check that from your own trades rather than with a fixed cutoff.
Plan the ratio. Then see what you really get.
Bring in your trades, add your stops and targets, and see your planned and realized R side by side.