 TradeBB
Profit factor in trading: what it is, and what makes yours good

Profit factor is the money your winning trades made divided by the money your losing trades lost. Above 1, you made money. Below 1, you lost it. Exactly 1, you broke even.
Five trades: +$300, −$100, +$150, −$200, +$250. Winners add up to $700, losers to $300. Profit factor: 700 ÷ 300 = 2.33.
That's the whole calculation. The harder question is the one most traders are actually asking: is my number good, and can I trust it?
How to calculate profit factor from your own trades
- List every closed trade in the period you want to measure, with its profit or loss
- Add up the winners — that's gross profit
- Add up the losers, ignoring the minus sign — that's gross loss
- Divide gross profit by gross loss
Two rules keep the number honest:
- Use net results, after commissions and fees. Profit factor is very sensitive to costs, as the next example shows.
- Never average profit factors. If you have one per month, add up the month's profits and losses first, then divide once.
Why averaging fails: say March made $3,000 on winners and lost $1,000 (profit factor 3.0), and April made $400 and lost $1,600 (0.25). The average of 3.0 and 0.25 is 1.63. But over both months you made $3,400 and lost $2,600, a profit factor of 1.31. The average makes you look better than you did.
What commissions do to your profit factor
Take 100 trades: 55 winners that made $5,000 before costs, 45 losers that lost $4,000. Before costs, profit factor is 1.25.
Now take off $10 per trade for commissions and slippage:
| Before costs | After $10 a trade | |
|---|---|---|
| Winners | $5,000 | $4,450 |
| Losers | $4,000 | $4,450 |
| Profit factor | 1.25 | 1.00 |
| Net result | +$1,000 | $0 |
A strategy that looks solidly profitable is, after costs, breaking even. The more often you trade and the smaller your average win, the bigger this gap gets, so for scalpers it can decide whether a strategy works at all.
What is a good profit factor?
Every list online gives a different answer: one calls 1.5 good, another wants 1.75, another 2. None says where its numbers come from. A more useful way to read yours is to answer three questions first.
1. How many trades is it based on?
On a few dozen trades, one big winner can carry the whole number. Run the check in the next section before trusting it.
2. Is it after costs?
If not, it's higher than what you earned. See the example above.
3. What kind of trading is it?
Profit factor depends on how often you win and how big your wins are compared to your losses. A trend follower who wins 35% of the time with large winners and a scalper who wins 65% of the time with small ones can both be profitable with very different profit factors. Compare yours to your own past, not to someone else's style.
Once those check out, two things hold for everyone: below 1.0 the trades lost money, and a very high profit factor on few trades usually means a handful of outsized winners, not an edge you can count on repeating.
Two checks before you trust the number
Check 1: remove your biggest winner. Take your best trade out and recalculate. Say 40 trades made $6,000 on winners and lost $4,000: profit factor 1.5. If the best trade alone made $1,800, without it you have $4,200 against $4,000, a profit factor of 1.05. Most of your edge was one trade.
Check 2: split your trades in half. Calculate profit factor separately for the first half of your trades and the second half, in date order. If both halves are above 1, the result is steadier than if one half carries the other.
Neither check needs statistics. Both tell you how much of your number you'd keep if the next month looks a little different from the last one.
Profit factor, win rate and expectancy: three views of the same trades
These three numbers come from the same two ingredients: how often you win, and how big your wins are compared to your losses.
- Win rate — how often
- Profit factor — total won compared to total lost
- Expectancy — what an average trade made, in dollars
They connect directly: profit factor = (win rate × average win) ÷ (loss rate × average loss).
| Trader A | Trader B | |
|---|---|---|
| Win rate | 45% | 70% |
| Average win | $180 | $50 |
| Average loss | $120 | $130 |
| Profit factor | 1.23 | 0.90 |
| Expectancy per trade | +$15 | −$4 |
Trader B wins far more often and still loses money. A high win rate says nothing on its own; it needs the size of wins against losses next to it. That ratio is your risk reward ratio.
Use profit factor to compare slices of your own trading, like one setup against another. Use expectancy when you want to know what a trade is worth in dollars.
Profit factor also ignores order. The same trades in a different sequence give the same profit factor, but a very different worst stretch. That's what max drawdown measures.
Profit factor by tag: read it with the trade count
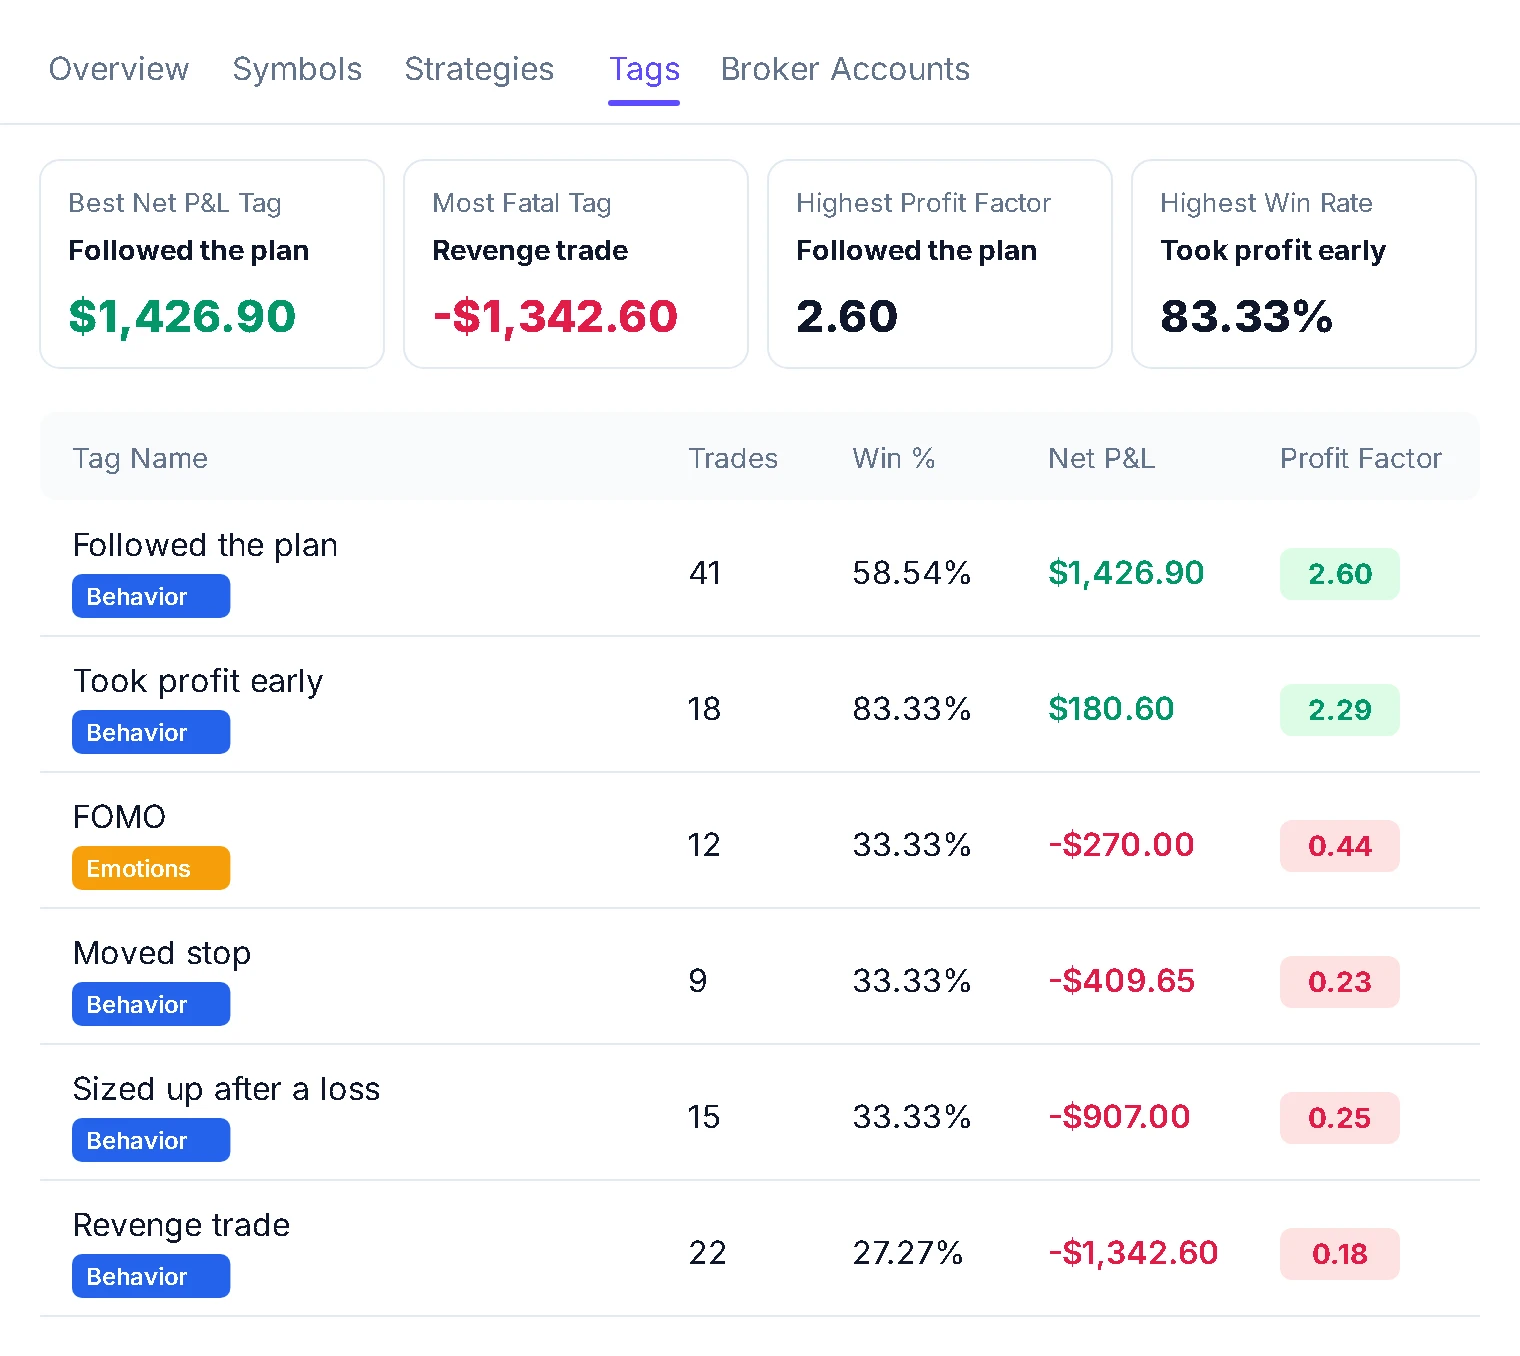
Profit factor gets most useful when you split it: by setup, by time of day, by the mistakes you tag. It also gets less reliable, because every slice has fewer trades than the whole.
That's the reason to read the three columns together. A tag with a high profit factor and few trades is a hint. A tag with a high profit factor, plenty of trades and a healthy expectancy is something to do more of. And a tag below 1 is a habit that costs you; there's more on putting a price on those in the trading psychology journal.
See profit factor for every tag you use — Start Your Journal →
Frequently asked questions
Gross profit from winning trades divided by gross loss from losing trades. Above 1 means the trades made money overall.
Gross profit from winning trades divided by gross loss from losing trades. Above 1 means the trades made money overall.
It means your winners made 1.5 times what your losers lost. Whether that's good depends on how many trades it's based on, whether costs are included, and how you trade. Check it against the three questions above.
It means your winners made 1.5 times what your losers lost. Whether that's good depends on how many trades it's based on, whether costs are included, and how you trade. Check it against the three questions above.
Yes. Calculate it from net results. For frequent traders, costs can turn a profit factor above 1 into a break-even result.
Yes. Calculate it from net results. For frequent traders, costs can turn a profit factor above 1 into a break-even result.
Then profit factor can't be calculated, because you'd be dividing by zero. It also means the sample is too small to say much yet.
Then profit factor can't be calculated, because you'd be dividing by zero. It also means the sample is too small to say much yet.
They answer different questions. Win rate says how often you win; profit factor adds how much. Profit factor tells you more about whether you make money, but read both, with expectancy, together.
They answer different questions. Win rate says how often you win; profit factor adds how much. Profit factor tells you more about whether you make money, but read both, with expectancy, together.
Your profit factor is already in your trades. Find out what's behind it.
Bring in your trades and see profit factor overall, per tag, and after costs.