 TradeBB
TRADING TOOLS
Stock Average Calculator
Add each time you bought, with the price and number of shares, to see your average price and the price you need to break even. Or enter a target average to see how many shares to buy.
Your average price is what you paid per share across all your buys: total cost divided by total shares. It's weighted by size, so a big buy moves it more than a small one. Averaging down means buying more below your average to lower it.
The formula
How to calculate your average stock price
Multiply each buy's price by its number of shares, add those up, and divide by all the shares you hold.
Example: you buy 100 shares at $50, then 300 more at $40. You've paid $5,000 + $12,000 = $17,000 for 400 shares, so your average is $42.50, not the $45 you'd get by averaging the two prices. The bigger buy pulls the average toward its price.
Fees count too. Add them to the total paid and the average becomes your true break-even price.
Average down and up
Averaging down and averaging up
- Averaging down — buying more after the price falls below your average. Your average drops, so the price doesn't need to climb all the way back to where you first bought to break even.
- Averaging up — buying more after the price rises above your average. Your average rises, and so does your break-even.
Example: 100 shares at $50, and the price falls to $40. Buy 100 more at $40 and your average is $45. The stock now has to recover to $45 to break even, instead of $50. From $40, that’s a 12.5% rise instead of 25%.
The trade-off
What averaging down changes besides your average
A lower average comes with a bigger position. In the example above, the second buy doubles your shares from 100 to 200. If the price keeps falling, each $1 drop now costs $200 instead of $100.
So the calculator shows both: the average you get, and how much more money is in the trade. Whether that's worth it depends on why the price fell and how much of your account you're willing to have in one stock. For sizing a position to a fixed risk, see the position size calculator.
Selling part
Selling part of the position: FIFO or average cost
When you sell some of your shares, your profit depends on which shares count as sold. Brokers use one of two methods:
- FIFO (first in, first out) — the oldest shares are sold first
- Average cost — every share you hold has the same average price
Example: buy 100 shares at $10, then 100 at $12, then sell 100 at $15.
| FIFO | Average cost | |
|---|---|---|
| Shares counted as sold | the 100 bought at $10 | 100 at the $11 average |
| Realized profit | $500 | $400 |
| Average of the 100 you still hold | $12 | $11 |
Once you've sold everything, both methods add up to the same total. The difference is how it's split along the way. Add a sale in the calculator to see both. For a single buy and sell, the stock profit calculator gives the profit, the return and the break-even price after fees.
Every fill
Scale in, scale out, keep it as one trade
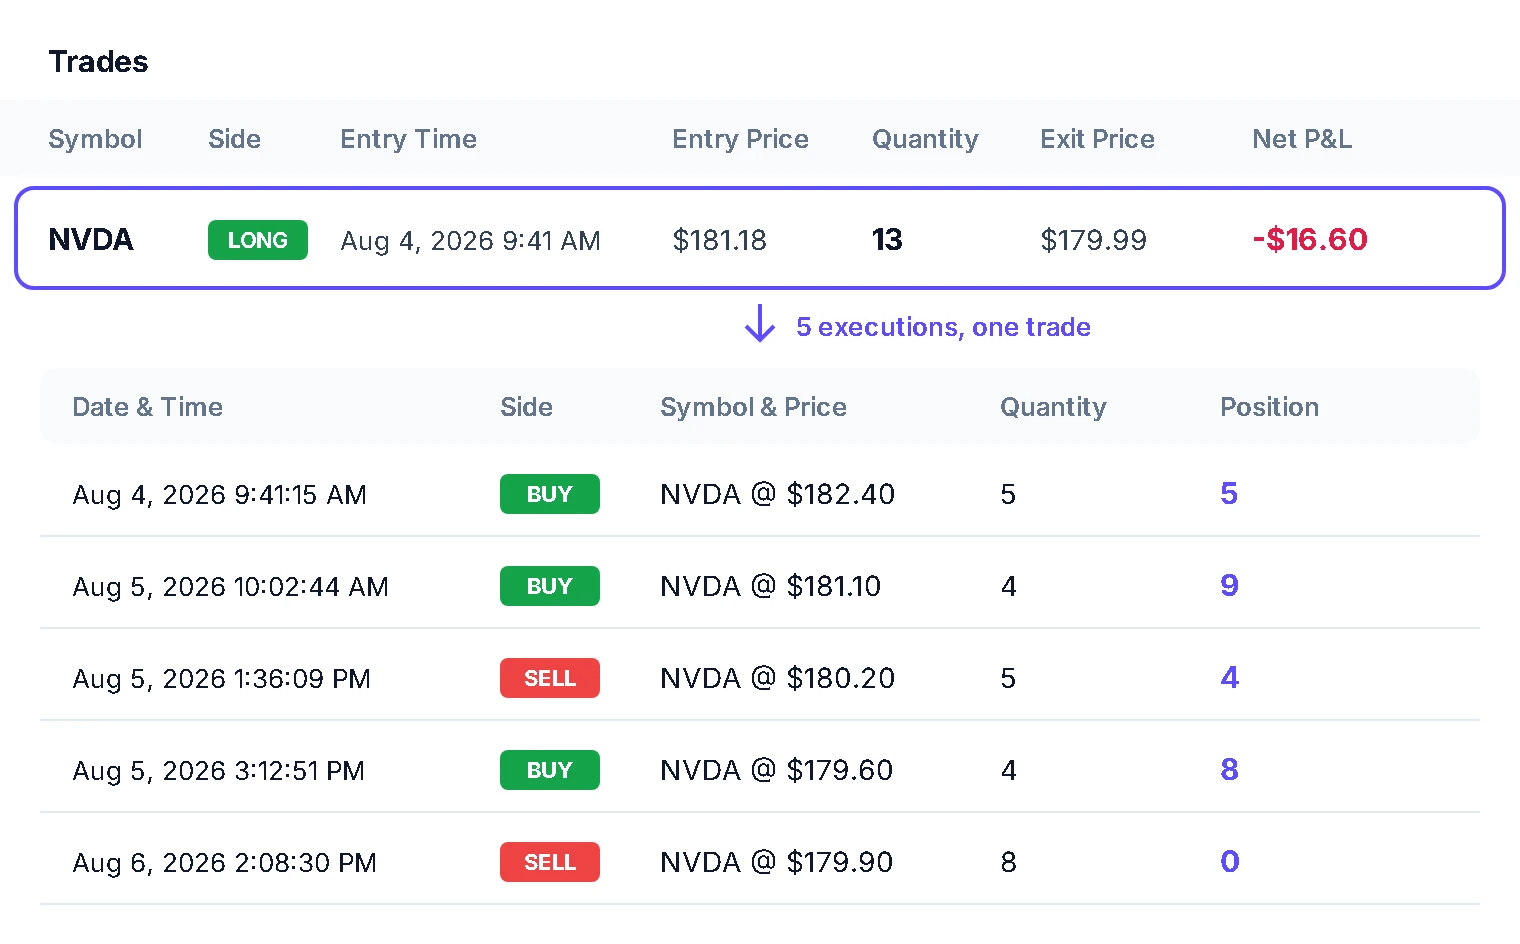
Averaging down or scaling out means many buys and sells for one idea. A spreadsheet turns that into a mess of rows. A trading journal keeps it as one trade.
- Every execution kept — each buy and sell, with the position after it
- One trade, one result — the P&L of the whole idea, after fees
- FIFO or weighted average — pick the method your broker uses, so scaled trades match your statement
Then you can see whether your averaged-down trades actually end up paying, across all of them. A trading journal is where that shows up. More on the two methods: FIFO vs weighted average in TradeBB.
FAQ
Frequently asked questions
How do I calculate my average stock price?
Multiply each buy's price by its shares, add them up, and divide by the total shares. 100 shares at $50 and 300 at $40 is $17,000 for 400 shares: $42.50.
How many shares do I need to buy to average down?
Shares held × (current average − target) ÷ (target − today's price). Holding 100 at $50 with the price at $40, reaching a $45 average takes 100 more shares.
Does averaging down lower my break-even?
Yes. Your break-even becomes the new average, plus fees. You also hold more shares, so each move in the price is worth more in either direction.
Should I include fees?
Yes, if you want the real break-even. Commissions and fees are part of what you paid, so they raise the average slightly.
Why is my broker's average different?
Usually because of fees, or because shares were sold along the way and your broker uses FIFO, which changes the average of the shares you still hold.
Does the stock average calculator work for crypto or fractional shares?
Yes. Quantities can have decimals, so it works for fractional shares and coins. Pick your currency at the top.
Average in on paper. See how it worked out in your journal.
Bring in your trades and see every scaled-in trade as one result, after fees.
Position size calculator → · Risk reward ratio calculator → · FIFO vs weighted average →